College Of The Canyons Math 140 Exam 1 Amy Morrow Page 6
ADVERTISEMENT
 1
1 2
2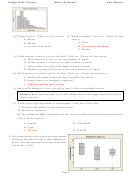 3
3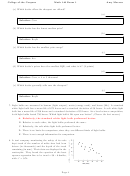 4
4 5
5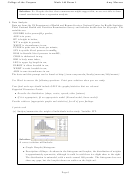 6
6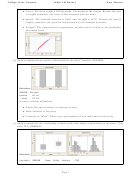 7
7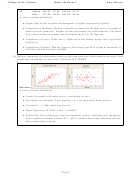 8
8College of the Canyons
Math 140 Exam 1
Amy Morrow
Solution: No. Despite the fact that commonsense might suggest this, we are not able to draw
causal conclusions from a regression analysis.
9. Data Analysis.
Data are from the US Department of Health and Human Services, National Center for Health Statistics,
Third National Health and Nutrition Examination Survey and includes health data for 80 people. The
variables are:
GENDER is the person¡92¿s gender,
AGE is in years,
HT is height in inches,
WT is weight in pounds,
WAIST is circumference in cm,
PULSE is pulse rate in beats per minute,
SYS is systolic blood pressure in mmHg,
DIAS is diastolic blood pressure in mmHG,
CHOL is cholesterol in mg,
BMI is body mass index,
LEG is upper leg length in cm,
ELBOW is elbow breadth in cm,
WRIST is wrist breadth in cm,
ARM is arm circumference in cm.
The data and this prompt can be found at
Use Word to answer the following questions. Print your solutions when you are ready.
Your final write-ups should include ONLY the graphs/statistics that are relevant.
Suggested Discussion Points:
Describe the distribution (shape, center, spread, other features)
If it is appropriate, fit an appropriate model (Normal model, linear model).
Provide evidence (appropriate graphs and statistics) for all of your findings.
3 points each
(a) Analyze/summarize the weight of individuals in the study. Variable: WT.
Solution:
A correct solution will include:
Graph: Boxplot/histogram.
Description of Shape: As shown in the histogram and boxplot, the distribution of weights
is approximately symmetric, although it could be said there is a slight skew to the right.
The distribution is unimodal, with a mode around 160 pounds. The histogram does not
show any gaps, but the boxplot shows an outlier on the high end.
Page 6
ADVERTISEMENT
0 votes
Related Articles
Related forms


")

Related Categories
Parent category: Life