Lab A - The International System Of Units (Si), Statistical Data, Graphs, And Contour Analysis Page 3
ADVERTISEMENT
, Statistical Data, Graphs, And Contour Analysis Printable pdf") 1
1 2
2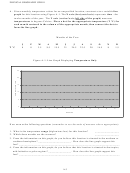 3
3 4
4 5
5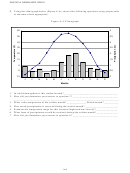 6
6 7
7 8
8PHYSICAL GEOGRAPHY GPH111
A. Given monthly temperature values for an unspecified location, construct a two variable line
graph for this location using Figure A-1. The X axis (horizontal axis) represents time - the
twelve months of the year. The Y axis (vertical axis, left side of the graph) measures
temperatures in degrees Celsius. Place a dot for the appropriate temperature (T ºC) for
each month centered in the column of the appropriate month, then connect the dots to
form the line graph.
Months of the Year
J
F
M
A
M
J
J
A
S
O
N
D
o
0
0
3.5
9.5
15.5
21
24.5
23.5
20
14.5
8
1.5
T
C
Figure A-1: Line Graph Displaying Temperature Only
25
20
15
10
5
0
J
F
M
A
M
J
J
A
S
O
N
D
Months
Now answer the following questions (remember to use the units of measure where appropriate):
1. What is the temperature range (high minus low) for this location?
_________________
2. Which three months are the warmest?
_________________
3. From the information on this graph, do you believe this location is situated in the northern or
southern hemisphere? _______________________. How does the line graph support this
fact? _______________________________________________________________________
4. From the information on this graph, do you believe that this location is situated in the tropics,
mid-latitudes or polar regions? ________________. How does the line graph support this
fact? _______________________________________________________________________
A-3
ADVERTISEMENT
0 votes
Related Articles
Related forms

 F.o.t.c./fuel Oil Tax Act/quarterly Return Of Fuel Oil Imported Into The Yukon In The Fuel System Of A Vehicle
Financial
F.o.t.c./fuel Oil Tax Act/quarterly Return Of Fuel Oil Imported Into The Yukon In The Fuel System Of A Vehicle
Financial


 - Exclusion Of Income From The International Operation Of Ships Or Aircraft Under Section 883 - 2017") Schedule S (form 1120-f) - Exclusion Of Income From The International Operation Of Ships Or Aircraft Under Section 883 - 2017
Financial
Schedule S (form 1120-f) - Exclusion Of Income From The International Operation Of Ships Or Aircraft Under Section 883 - 2017
Financial
 - Exclusion Of Income From The International Operation Of Ships Or Aircraft Under Section 883 - 2015") Schedule S (form 1120-f) - Exclusion Of Income From The International Operation Of Ships Or Aircraft Under Section 883 - 2015
Financial
Schedule S (form 1120-f) - Exclusion Of Income From The International Operation Of Ships Or Aircraft Under Section 883 - 2015
Financial
 - Exclusion Of Income From The International Operation Of Ships Or Aircraft Under Section 883 - 2014") Schedule S (form 1120-f) - Exclusion Of Income From The International Operation Of Ships Or Aircraft Under Section 883 - 2014
Financial
Schedule S (form 1120-f) - Exclusion Of Income From The International Operation Of Ships Or Aircraft Under Section 883 - 2014
Financial
 - Exclusion Of Income From The International Operation Of Ships Or Aircraft Under Section 883 - 2013") Schedule S (form 1120-f) - Exclusion Of Income From The International Operation Of Ships Or Aircraft Under Section 883 - 2013
Financial
Schedule S (form 1120-f) - Exclusion Of Income From The International Operation Of Ships Or Aircraft Under Section 883 - 2013
Financial


Related Categories
Parent category: Education