Thinking About Climate Change
ADVERTISEMENT
 1
1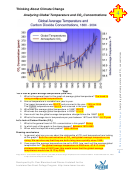 2
2Thinking About Climate Change
4
Analyzing Global Temperature and CO
Concentrations
2
Let’s look at global average temperature (blue line)
1. What is the general trend in this graph of average global temperature? _____________
______________________________________________________________________
2. Annual temperature is variable from year to year.
The lowest temperature was _______ and occurred in the year _______.
The highest temperature was _______ and occurred in the year _______.
3. What was the average global temperature in 1880? _______
4. What was the average global temperature in 2004? _______
5. How much has the global average temperature changed since the 1880? _______
6. What is the average rise in temperature per year between 1970 and 2000? _______
Let’s look at Carbon Dioxide (CO
)
2
1. What is the general trend of CO
concentration in this graph? _______
2
2. In which part of the graph is the slope steepest? _______________________
3. When was the slope the most gradual? _______________________
Drawing conclusions
1. In general, what can you say about the relationship of CO
and temperature from looking
2
at this graph?
______________________________________________________________________
______________________________________________________________________
2. If we project this average out to 2025, how much will the average global temperature be?
______
4
Image Source: Conservation Report (February 28, 2009) Global average temperature and CO
concentrations. Accessed October 30, 2009
2
at
Developed by Dr. Pam Blanchard and Dianne Lindstedt for the
Louisiana Sea Grant College Program
ADVERTISEMENT
0 votes
Related Articles
Related forms


")
")
 Chord Chart")
")


Related Categories
Parent category: Miscellaneous