Publication 1542 Per Diem Rates (For Travel Within The Continental United States) Page 10
ADVERTISEMENT
 Printable pdf") 1
1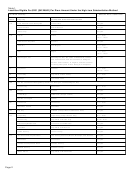 2
2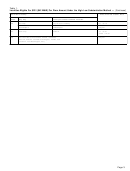 3
3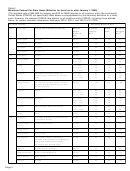 4
4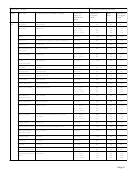 5
5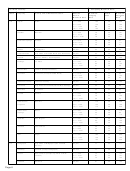 6
6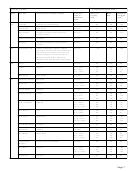 7
7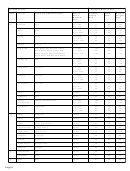 8
8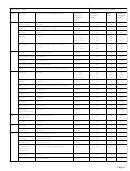 9
9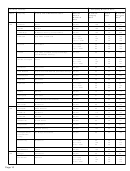 10
10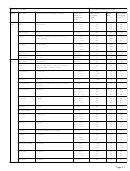 11
11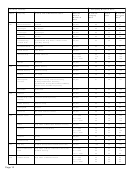 12
12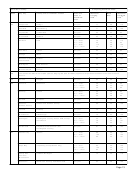 13
13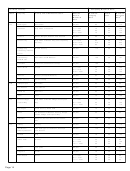 14
14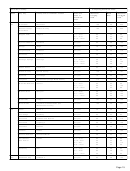 15
15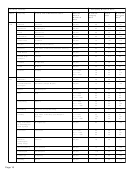 16
16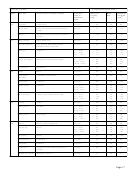 17
17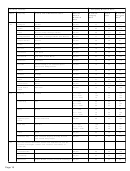 18
18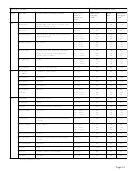 19
19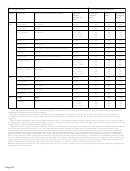 20
20 21
21 22
22Per Diem Locality:
Computing Maximum Rate:
1
2, 3
State
Key City
County and/or Defined Location
Effective
Maximum
M&IE
Maximum
Date of
Lodging
Rate
Per Diem
4
Maximum
Rate
Rate
Rate
MA
Andover
Essex
All year
109
38
147
Boston
Suffolk
All year
192
46
238
Cambridge
Middlesex County (except Lowell)
All year
192
46
238
Falmouth
City limits of Falmouth
1/1 – 5/31
70
38
108
6/1 – 10/10
105
38
143
10/11 – 12/31
70
38
108
Hyannis
Barnstable
1/1 – 6/30
65
38
103
7/1 – 9/30
94
38
132
10/1 – 12/31
65
38
103
Lowell
City limits of Lowell, except Cambridge,
All Year
99
34
133
(see Middlesex County)
Martha’s Vineyard
Dukes
1/1 – 5/31
75
46
121
6/1 – 9/30
160
46
206
10/1 – 12/31
75
46
121
Nantucket
Nantucket
All year
90
46
136
New Bedford
City limits of New Bedford (see Bristol County)
All year
65
34
99
Northampton
Hampshire
All year
70
34
104
Pittsfield
Berkshire
All year
59
38
97
Plymouth
Plymouth
1/1 – 5/31
56
34
90
6/1 – 10/31
98
34
132
11/1 – 12/31
56
34
90
Quincy
Norfolk
All year
74
38
112
Springfield
Hampden
All year
67
34
101
Taunton
Bristol (except New Bedford)
All year
64
30
94
Worcester
Worcester
All year
89
34
123
MD
Annapolis
Anne Arundel
All year
90
42
132
Baltimore
Baltimore
All year
110
42
152
Columbia
Howard
All year
109
42
151
Grasonville
Queen Annes
All year
63
38
101
Hagerstown
Washington
All year
56
34
90
Harford County
Harford County
All year
104
38
142
Lexington Park/
St. Marys and Calvert
All year
66
34
100
Leonardtown/
Lusby
Ocean City
Worcester
1/1 – 5/31
55
46
101
6/1 – 9/15
129
46
175
9/16 – 12/31
55
46
101
St. Michaels
Talbot
All year
100
42
142
ME
Bangor
Penobscot
All year
56
30
86
Bar Harbor
Hancock
1/1 – 6/30
75
38
113
7/1 – 9/15
104
38
142
9/16 – 12/31
75
38
113
Page 10
ADVERTISEMENT
0 votes
Related Articles
Related forms
")

 Affidavit Of Parental Consent For Travel Throughtout The United States Of A Minor Child Without Parents Traveling
Legal
Affidavit Of Parental Consent For Travel Throughtout The United States Of A Minor Child Without Parents Traveling
Legal
 Affidavit Of Parental Consent Form - For Travel Outside The United States Of A Minor Child - Without Both Birth Parents Traveling
Legal
Affidavit Of Parental Consent Form - For Travel Outside The United States Of A Minor Child - Without Both Birth Parents Traveling
Legal

 Motion For Payment Of Unclaimed Funds - United States Bankruptcy Court For The Southern District Of Iowa
Legal
Motion For Payment Of Unclaimed Funds - United States Bankruptcy Court For The Southern District Of Iowa
Legal
 Instruction Form For On-site Review Of United States Courts Case Files At The National Archive And Records Administration Form
Legal
Instruction Form For On-site Review Of United States Courts Case Files At The National Archive And Records Administration Form
Legal

 - Request For Waiver Of Training Requirement - United States Bankruptcy Court - Western District Of New York Form")

Related Categories
Parent category: Financial