Aimssec Birthday Bar Chart - African Institute For Mathematical Sciences Page 2
ADVERTISEMENT
 1
1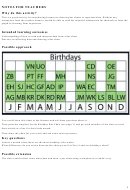 2
2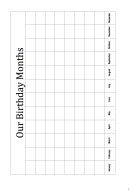 3
3NOTES FOR TEACHERS
Why do this activity?
This is a good activity for introducing learners to drawing bar charts to represent data. Without any
instruction from the teacher learners should be able to read the required information for themselves from the
graph so learning from experience.
Intended learning outcomes
Understanding of how to read and interpret data from a bar chart.
Practice in collecting data and drawing a bar chart.
Possible approach
You could show this chart to the learners and ask them questions about it.
Then print the template for the Birthday Bar Chart (see page 3) and get each member of the class to write
their initials in a box for their birth month.
Then show the chart for your class and ask some more questions.
Key questions
Is there a month when there are the most birthdays (the mode)
What differences do you notice between the chart given for Class 4 and our birthdays chart?
Possible extension
The class could collect some other data and draw a par chart using a template in a similar way.
2
ADVERTISEMENT
0 votes
Related Articles
Related forms
 Heights And Distances Trigonometry Worksheet With Answers - The Institute Of Mathematical Science
Education
Heights And Distances Trigonometry Worksheet With Answers - The Institute Of Mathematical Science
Education


 Comp232 - Mathematics For Computer Science - Ali Moallemi, Iraj Hedayati - Concordia University
Education
Comp232 - Mathematics For Computer Science - Ali Moallemi, Iraj Hedayati - Concordia University
Education


Related Categories
Parent category: Education