Rit Reference Chart For Mathematics 2 '- 5 With Answers - Nwea
ADVERTISEMENT
 1
1 2
2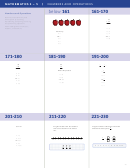 3
3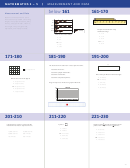 4
4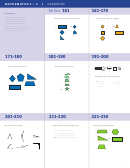 5
5RIT
Reference Chart for Mathematics 2 – 5
MAP tests produce scores that make it possible to monitor student growth from year to year along
developmental curriculum scales or continua. The chart inside shows examples of the kinds of work
students can do at various points along the MAP RIT scale, assuming they have been exposed to content.
This type of information is helpful in supporting appropriate instruction.
Please note that each subject area has a unique alignment to the RIT scale. As a result, scores between
subjects are not equivalent.
How to use the charts:
1. Find the column containing the student’s score for a particular subject. For example, if the
student’s score in “Geometry” is 188, refer to the column labeled 181-190.
2. Read the column(s) from left to right to locate a sample test question for a given reporting
area, such as “Geometry.” A student’s score suggests that, currently, he or she is likely to get
about half of the questions of this difficulty correct.
3. Now look at the questions in the column(s) to the left, and higher on the page. The student is
likely to get most of these correct, assuming he or she has been instructed in these skills and
concepts.
4. The questions further down the page will probably require new learning on the student’s part.
Please note:
Test items in this booklet are sample items, and many are not calibrated or field-tested. For purposes of
this document, RIT scale alignment is an approximation.
ADVERTISEMENT
0 votes
Related Articles
Related forms


")


Related Categories
Parent category: Education