European/non-European Study Abroad Conversion Chart (For Use From The 2013/14 Academic Year) Page 2
ADVERTISEMENT
 Printable pdf") 1
1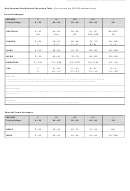 2
2As approved by the Undergraduate Studies Committee on 28th March 2013
Non-European Study Abroad Conversion Table (for use from the 2013/14 academic year)
Current Exchanges:
IRELAND
F
III
II.2
II.1
I
Trinity College
0 – 39
40 – 49
50 – 59
60 – 69
70+
a
1
AUSTRALIA
0 – 49
50 – 59
60 – 69
70 – 79
80 –100
Fail
Pass
H3
H2A - H2B
H1
CANADA
0 – 49
50 – 59
60 – 69
70 – 79
80 – 100
F
D – C
C+ – B-
B – B+
A- – A
CHINA
0 – 59
60 – 69
70 – 79
80 – 89
90 – 100
JAPAN
0 – 59
60 – 69
70 – 79
80 – 89
90 – 100
SINGAPORE
0 – 3.19
3.2 – 3.49
3.5 – 3.99
4.0 – 4.49
4.5 – 5.0
USA
F
D- – D+
C- – C+
B- – B+
A- – A
0
0.7 – 1.3
1.7 – 2.3
2.7 – 3.3
3.7 – 4.0
Important:
1. Where there is a range of results, the top of the range should be used unless evidence is provided to suggest otherwise.
2. It may be necessary to revise this table annually as new exchanges and information and feedback is received.
ECTS equivalents:
Please see the ECTS Equivalents Credit Table for UK & Non-European Study Abroad for detailed information of ECTS equivalents for each of the
above countries.
Footnotes:
a. Some Australian universities consider 85 – 100 as a First and 75 – 84 as an Upper Second.
Potential Future Exchanges:
IRELAND
F
III
II.2
II.1
I
Trinity College
0 – 39
40 – 49
50 – 59
60 – 69
70+
BRAZIL
0 – 49
50 – 64
65 – 74
75 – 84
85+
INDIA
0 – 39
40 – 44
45 – 54
55 – 64
65 – 100
ADVERTISEMENT
0 votes
Related Articles
Related forms


 Form 2804 - 2009 Equalization Study: Single-year Study Sales Ratio Adjustments For Use In Determining The 2010 Starting Base
Financial
Form 2804 - 2009 Equalization Study: Single-year Study Sales Ratio Adjustments For Use In Determining The 2010 Starting Base
Financial
 Form N-289 - Certification For Exemption From The Withholding Of Tax On The Disposition Of Hawaii Real Property - 2013
Financial
Form N-289 - Certification For Exemption From The Withholding Of Tax On The Disposition Of Hawaii Real Property - 2013
Financial


 For Use With The Weight Management Treatment Algorithm")
Related Categories
Parent category: Life