1.2 Unpaired T-Tests Page 2
ADVERTISEMENT
 1
1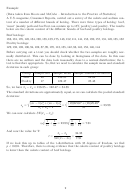 2
2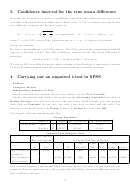 3
3Example:
(Data taken from Moore and McCabe – Introduction to the Practice of Statistics)
A U.S. magazine, Consumer Reports, carried out a survey of the calorie and sodium con-
tent of a number of different brands of hotdog. There were three types of hotdog: beef,
’meat‘ (mainly pork and beef but can contain up to 15% poultry) and poultry. The results
below are the calorie content of the different brands of beef and poultry hotdogs.
Beef hotdogs:
186 181 176 149 184 190 158 139 175 148 152 111 141 153 190 157 131 149 135 132
Poultry hotdogs:
129 132 102 106 94 102 87 99 170 113 135 142 86 143 152 146 144
Before carrying out a t-test you should check whether the two samples are roughly nor-
mally distributed. This can be done by looking at histograms of the data. In this case
there are no outliers and the data look reasonably close to a normal distribution; the t-
test is therefore appropriate. So, first we need to calculate the sample mean and standard
deviation in each group:
Group
Sample size Sample mean Sample standard deviation
Beef
20
156.85
22.64
Poultry
17
122.47
25.48
So, we have ¯
¯
= 156 85
122 47 = 34 38
1
2
The standard deviations are approximately equal, so we can calculate the pooled standard
deviation:
2
2
2
2
(
1)
+ (
1)
(19)22 64
+ (16)25 48
1
2
1
2
=
=
= 23 98
+
2
35
1
2
We can now calculate
(¯
¯
):
1
2
1
1
1
1
+
= 23 98
+
= 7 91
20
17
1
2
And now the value for T:
¯
¯
34 38
1
2
=
=
(¯
¯
)
7 91
1
2
If we look this up in tables of the t-distribution with 35 degrees of freedom, we find
0 001. Therefore, there is strong evidence that the calorie content of poultry hotdogs
is lower than the calorie content of beef hotdogs.
2
ADVERTISEMENT
0 votes
Related Articles
Related forms


")


Related Categories
Parent category: Education