Experimental Design Test - Paper Airplane Page 3
ADVERTISEMENT
 1
1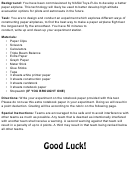 2
2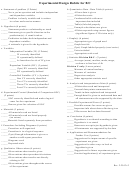 3
3Experimental Design Rubric for B/C
a. Statement of problem (2 Points)
h. Quantitative Data - Data Table (6 points)
_____ Not a yes/no question and includes independent
_____ All raw data is given
and dependent variables
_____ All data has units
_____ Problem is clearly testable and is written
_____ Condensed table with most
in a clear and concise manner
important data included
_____ Table(s) labeled properly
b. Hypothesis (4 points)
_____ Example calculations are given
_____ Statement predicts a relationship or trend
_____ All data reported using correct figures
_____ Statement gives specific direction to the
(significant figures C Division only)
predictions(s): A stand is taken.
_____ Prediction includes both independent and
i. Graph(s) (6 points)
dependent variables
_____ Appropriate type of graph used
_____ A rationale is given for the hypothesis.
_____ Graph has title
_____ (2pts) Graph labeled properly (axes/series)
c. Variables
_____ Units included
Independent Variable (IV) (3 Points)
_____ Appropriate scale used
_____ IV correctly identified
_____ IV operationally defined
j. Statistics Division B&C– (2 points)
_____ At least three levels of IV given
_____ Average (mean), median, mode, range,
or drawn in line best of-fit
Dependent Variable (DV) (3 points)
Division C only (4 more points)
_____ (2pts) DV correctly identified
_____ Measure of central tendency
_____ DV operationally defined
_____ Measure of variation
_____ Regression analysis
Controlled Variables (CV) (4 points)
_____ Other appropriate statistic used
_____ One CV correctly identified
_____ Two CVs correctly identified
k. Analysis and interpretation of data (4 points)
_____ Three CVs correctly identified
_____ All data discussed and interpreted
_____ Four CVs correctly identified
_____ Unusual data points commented on
_____ Trends in data explained and interpreted
d. Experimental Control (Standard of Comparison-SOC)
_____ Enough detail is given to understand data and
(2 points)
all statements must be supported by the data.
_____ SOC correctly identified and makes logical
sense for the experiment
l. Possible Experimental Errors (3 points)
_____ Reason given for selection of SOC
_____ Possible reasons for errors are given
_____ Important info about data collection given
e. Materials (3 points)
_____ Effect errors had on data discussed
_____ All materials used are listed
_____ All materials used are listed properly
m. Conclusion (4 points)
(no extras)
_____ Hypothesis is evaluated according to data
_____Materials listed separately from procedure
_____ Hypothesis is re-stated
_____ Reasons to accept/reject hypothesis given
f. Procedure: Including Diagrams (6 points)
_____ All statements are supported by the data
_____ Procedure well organized
_____ Procedure is in a logical sequence
n. Applications and Recommendations for
_____ (2pts) Enough information is given so
Further Use (4 points)
another could repeat procedure
_____ Suggestions for improvement of specific
_____ Diagrams used
experiment are given
_____ Repeated trials
_____ Suggestion for other ways to look at
hypothesis given
g. Qualitative Observations (4 points)
_____ Suggestions for future experiments given
_____ Observations about results given
_____ Practical application(s) of experiment given
_____ Observations about procedure/deviations
_____ Observations about results not directly
relating to DV
_____ Observations given throughout the course
Rev. 2-29-12v2
of the experiment.
ADVERTISEMENT
0 votes
Related Articles
Related forms


 Template")
 Format")


Related Categories
Parent category: Education