Form Tpp 807f - Monthly Inventory - Cost Of Sales Method Page 2
Download a blank fillable Form Tpp 807f - Monthly Inventory - Cost Of Sales Method in PDF format just by clicking the "DOWNLOAD PDF" button.
Open the file in any PDF-viewing software. Adobe Reader or any alternative for Windows or MacOS are required to access and complete fillable content.
Complete Form Tpp 807f - Monthly Inventory - Cost Of Sales Method with your personal data - all interactive fields are highlighted in places where you should type, access drop-down lists or select multiple-choice options.
Some fillable PDF-files have the option of saving the completed form that contains your own data for later use or sending it out straight away.
ADVERTISEMENT
 1
1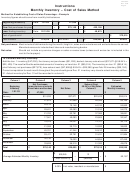 2
2TPP 807F
Rev. 5/04
Instructions
Page 2
Monthly Inventory – Cost of Sales Method
Method for Establishing Cost of Sales Percentage – Example
Inventory figures should come from monthly trial balances
1/01/05
47,050
Beginning Inventory
Date:
$
Plus: Net purchases for year
+
$
375,140
=
$
422,190
Less: Ending inventory
Date:
-
$
12/31/05
49,675
Cost of goods sold .................................................................................................................................
$
372,515
625,655
Cost of sales
$
372,515
÷
Net sales
$
=
59.54%
Net purchases: Must include all deliveries during the month, freight-in, sales and excise taxes and exclude discounts earned.
Manufacturers are to include direct labor and manufacturing burden.
Net sales:
Should not include any service charges or sales or excise taxes (unless such excise tax is included in the
cost to the taxpayer).
To Calculate Monthly Inventory:
Add the Jan. 1 inventory ($47,050), the January net purchases ($31,293); deduct January sale at cost ($37,671 @ 59.54% =
$22, 429). The result will be the estimated amount of inventory on hand Jan. 31 ($55,914). The inventory on Jan. 31 ($55,914),
plus February net purchases ($27,675), less sales at cost ($47,698 @ 59.54% = $28,399) gives Feb. 28 inventory ($55,190).
Correct computation for each month throughout the year should give a Dec. 31 inventory very close to actual inventory at Dec.
31. Actual inventory for Dec. 31 will be recorded in column 5.
Column 1
Column 2
Column 3
Column 4
Column 5
Net Purchases
Sales at Cost
Beginning
(manufacturers include
59.54% of Net Sales
Estimated
Inventory
direct labor and burden)
Net Sales
Column 3
Monthly Inventory
1/01/03
47,050
Date:
$
$
$
$
January
$31,293
$37,671
$22,429
$55,914
February
27,675
47,698
28,399
55,190
March
45,415
55,862
75,148
44,743
April
29,421
52,083
31,010
54,273
May
21,763
62,791
37,385
38,651
June
17,561
40,083
23,865
32,347
July
18,076
24,037
14,311
36,112
August
21,006
30,710
18,285
38,833
September
45,761
59,984
41,344
24,610
October
53,411
52,791
31,431
81,964
November
30,130
75,000
44,654
67,440
December
33,628
51,393
49,675
86,319
Total
$
$
$
$
375,140
625,655
372,515
626,245
$
626,245
12
Average Estimated Monthly Inventory
÷
=
$
52,187
(Total column 5)
(Months)
0.00%
List value, merchant or manufacturer
$
ADVERTISEMENT
0 votes
Related Articles
Related forms


Related Categories
Parent category: Financial