Vertex Form Algebra Worksheet
ADVERTISEMENT
 1
1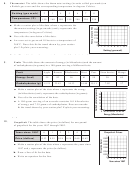 2
2Name ———————————————————————
Date — — — — — — — — — — — —
Name ———————————————————————
Date — — — — — — — — — — — —
Name ———————————————————————
Date — — — — — — — — — — — —
Practice B
Practice B
Practice B
LESSON
LESSON
LESSON
Algebra 1: 5.6 & 5.7 Homework
5.6
5.6
Name
5.6
For use with pages 325 – 333
For use with pages 325 – 333
For use with pages 325 – 333
Tell whether x and y show a positive correlation, a negative correlation, or
Tell whether x and y show a positive correlation, a negative correlation, or
Tell whether x and y show a positive correlation, a negative correlation, or
relatively no correlation.
relatively no correlation.
relatively no correlation.
1.
2.
3.
y
y
y
1.
2.
3.
y
y
y
1.
2.
3.
y
y
y
5
5
5
3
3
3
3
3
3
3
3
3
1
1
1
1
1
1
1
3
x
1
3
x
23
21
23
21
1
3
x
1
3
x
23
21
23
21
1
3
x
1
3
x
23
21
23
21
Name ———————————————————————
Date — — — — — — — — — — — —
21
21
21
21
21
21
1
3
x
23
21
1
3
x
23
21
1
3
x
23
21
21
21
21
23
23
23
23
Practice B
23
23
LESSON
23
continued
23
5.6
23
For use with pages 325 – 333
Make a scatter plot of the data. Draw a line of fit. Write an equation for
Make a scatter plot of the data. Draw a line of fit. Write an equation for
Make a scatter plot of the data. Describe the correlation of the data.
Make a scatter plot of the data. Draw a line of fit. Write an equation for
the line.
the line.
If possible, fit a line to the data and write an equation of the line.
the line.
4.
5.
4.
5.
8.
9.
4.
5.
x
x
0
1
2
3
0
0
0.5
1.5
2
2.5
22
21
x
x
x
0
1
2
3
x
0
0
0.5
1.5
2
2.5
x
0
1
1
2
x
0
1
22
21
0
1
2
3
0
0
0.5
1.5
2
2.5
22
22
21
24
23
22
22
21
22
21
y
y
4
2
1
1
3
4
22
21
22
24
23
21.5
y
y
y
4
2
1
y
1
3
4
y
0
2
1
y
7
5
6
3
4
2
1
22
21
22
24
23
21.5
4
24
2
23
1
22
21
1
3
4
22
21
22
24
23
21.5
y
y
y
y
y
y
y
y
7
3
3
3
3
3
3
3
5
1
1
1
1
1
1
1
x
3
1
3
23
21
x
1
3
23
21
x
1
3
x
1
3
23
21
x
1
3
23
21
21
x
23
21
1
3
23
21
x
1
3
21
23
21
21
21
21
21
21
1
23
23
23
23
23
23
23
1
3
x
23
21
21
6.
7.
Thermostat The table shows the thermostat setting (in units called gas marks) on
10.
6.
7.
x
x
6.
0
1
2
7.
0
4
3
2
1
0
23
22
21
x
x
0
1
2
0
4
3
2
1
0
x
x
23
22
21
0
1
2
0
4
3
2
1
0
23
22
21
a British gas oven and the corresponding temperature in degrees Celsius.
y
y
1
0
0
1
1
21
22
24
25
23
22
21
y
y
1
0
0
1
1
y
y
21
22
24
25
23
22
21
1
0
0
1
1
21
22
24
25
23
22
21
Setting (gas mark)
2
3
4
5
6
7
8
y
y
Temperature (8C)
150
160
180
190
200
220
230
y
y
y
y
3
3
3
1
1
Make a scatter plot of the data where x represents the
1
a.
1
y
x
1
3
23
21
1
1
thermostat setting (in gas marks) and y represents the
x
1
3
250
21
23
21
x
1
3
23
21
x
1
3
5
23
21
21
21
temperature (in degrees Celsius).
x
1
3
5
21
225
23
21
1
3
5
x
23
21
21
21
23
200
Describe the correlation of the data.
b.
23
23
23
175
An oven set to gas mark 10 heats to a temperature of
23
c.
23
25
150
25
2608C. Does this fit the trend shown by your scatter
25
25
0
x
25
0
1 2 3
4 5 6 7 8
25
plot? Explain your reasoning.
Setting (gas mark)
Fruits The table shows the amount of energy (in kilocalories) and the amount
11.
of carbohydrates (in grams) in a 100-gram serving of different fruits.
ADVERTISEMENT
0 votes
Related Articles
Related forms


Related Categories
Parent category: Education