Vertex Form Algebra Worksheet Page 2
ADVERTISEMENT
 1
1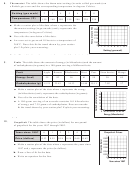 2
223
3
x
1
3
23
21
Practice A
1
3
x
23
21
LESSON
21
21
continued
5.6
1
For use with pages 325 – 333
8.
23
Thermostat The table shows the thermostat setting (in units called gas marks) on
10.
1
3
x
23
21
21
Make a scatter plot of the data. Draw a line of fit. Write an equation for
a British gas oven and the corresponding temperature in degrees Celsius.
the line.
Thermostat The table shows the thermostat setting (in units called gas marks) on
10.
Setting (gas mark)
2
3
4
5
6
7
8
13.
y
a British gas oven and the corresponding temperature in degrees Celsius.
x
0
1
1
2
4
5
6
7
Temperature (8C)
150
160
180
190
200
220
230
y
2
3.5
2.5
3.5
4
5
5
Setting (gas mark)
2
3
4
5
6
7
8
5
a.
Make a scatter plot of the data where x represents the
y
Temperature (8C)
150
160
180
190
200
220
230
thermostat setting (in gas marks) and y represents the
3
250
temperature (in degrees Celsius).
225
Make a scatter plot of the data where x represents the
a.
y
1
200
Describe the correlation of the data.
b.
thermostat setting (in gas marks) and y represents the
250
175
x
1
3
5
7
temperature (in degrees Celsius).
21
225
An oven set to gas mark 10 heats to a temperature of
c.
21
150
200
Describe the correlation of the data.
b.
2608C. Does this fit the trend shown by your scatter
0
175
x
0
1 2 3
4 5 6 7 8
plot? Explain your reasoning.
An oven set to gas mark 10 heats to a temperature of
c.
14.
y
150
x
2
2
3
4
22
21
Setting (gas mark)
3
2608C. Does this fit the trend shown by your scatter
0
x
0
1 2 3
4 5 6 7 8
plot? Explain your reasoning.
y
Fruits The table shows the amount of energy (in kilocalories) and the amount
20.5
21
21.2
21.5
21.5
21.8
11.
1
Setting (gas mark)
of carbohydrates (in grams) in a 100-gram serving of different fruits.
1
3
5
x
23
21
9.
Fruits The table shows the amount of energy (in kilocalories) and the amount
11.
21
of carbohydrates (in grams) in a 100-gram serving of different fruits.
Fruit
Apple
Banana
Blueberries
Kiwi
Pear
Strawberries
Mango
23
Energy (kcal)
59
92
56
61
59
30
65
Fruit
Apple
Banana
Blueberries
Kiwi
Pear
Strawberries
Mango
25
Carbohydrates (g)
Energy (kcal)
15.25
23.43
14.13
14.88
15.11
7.02
17
59
92
56
61
59
30
65
Carbohydrates (g)
15.25
23.43
14.13
14.88
15.11
7.02
17
a.
Make a scatter plot of the data where x represents the energy
Electricity Prices The scatter plot shows the cost
15.
y
Electricity Prices
(in kilocalories) and y represents the carbohydrates (in grams).
Make a scatter plot of the data where x represents the energy
(in dollars) of one kilowatt-hour of electricity for
a.
25
y
y
Describe the correlation of the data.
b.
the years 1990 to 2002. Describe the correlation
(in kilocalories) and y represents the carbohydrates (in grams).
20
8.60
25
15
of the data.
A 100-gram serving of an avocado contains 161 kilocalories
c.
Describe the correlation of the data.
b.
8.40
20
10
of energy and 7.39 grams of carbohydrates. Does an avocado
8.20
15
A 100-gram serving of an avocado contains 161 kilocalories
c.
5
fit the trend shown by your scatter plot? Explain your reasoning.
8.00
10
of energy and 7.39 grams of carbohydrates. Does an avocado
0
7.80
5
x
0
30 40 50
60 70 80 90
fit the trend shown by your scatter plot? Explain your reasoning.
0
0
Energy (kilocalories)
x
x
0
0
30 40 50
3
6
60 70 80 90
9
12
Algebra 1
Energy (kilocalories)
Years since 1990
66
Chapter 5 Resource Book
Algebra 1
66
10.
Chapter 5 Resource Book
Grapefruit The table shows the price (in dollars) for one pound
16.
of grapefruit for the years 1997 through 2002.
Years since 1997
Grapefruit Prices
0
1
2
3
4
5
y
Price (dollars)
0.53
0.55
0.58
0.58
0.60
0.62
0.62
0.60
Make a scatter plot of the data where x represents the years since
a.
0.58
1997 and y represents the price (in dollars).
0.56
0.54
b.
Draw a line of fit for the data.
0.52
c.
Write an equation for the line.
0
x
0
1 2 3
4 5
Years since 1997
Algebra 1
64
Chapter 5 Resource Book
ADVERTISEMENT
0 votes
Related Articles
Related forms


Related Categories
Parent category: Education