Trigonometry Worksheet With Answers - Grade 8 - Pulaski County Special School District Page 6
ADVERTISEMENT
 1
1 2
2 3
3 4
4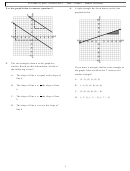 5
5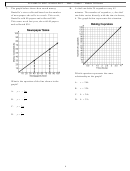 6
6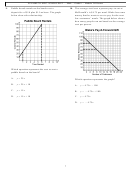 7
7 8
8 9
9 10
10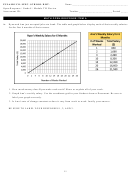 11
11 12
12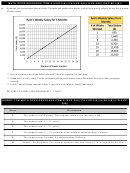 13
13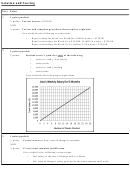 14
14 15
15PULASKI CO. SPEC. SCHOOL DIST. – Math – Grade 8 – Module TLI Review
7.
The graph below shows how much money
8.
A chef can bake 24 cupcakes every 45
Danielle’s store collected based on the number
minutes. The number of cupcakes, c, the chef
of newspapers she sells in a week. This week,
can bake varies directly with the time in hours,
Danielle sold 80 papers and collected $60.
h. The graph below represents this situation.
This same week last year, she sold 40 papers
and collected $30.
Which equation represents the same
relationship as the graph?
What is the equation of the line shown in the
A. c = 24h
graph?
B.
c = 32h
4
A.
y = −
x
3
C.
h = 24c
3
B.
y = −
x
D. h = 32c
4
3
C.
y =
x
4
4
D.
y =
x
3
6
ADVERTISEMENT
0 votes
Related Articles
Related forms


Related Categories
Parent category: Education