Math Activity Sheets - Grade 5 Page 9
ADVERTISEMENT
 1
1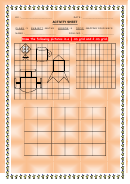 2
2 3
3 4
4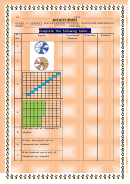 5
5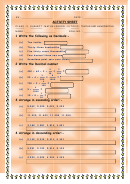 6
6 7
7 8
8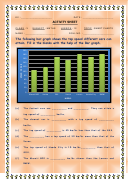 9
9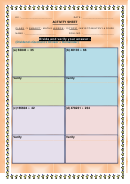 10
10 11
11 12
12 13
13 14
14KV : _____________________
DATE : _____________________
ACTIVITY SHEET
CLASS : V
SUBJECT : MATHS
LESSON : 12
TOPIC :
SMART CHARTS
NAME : _____________________
ROLL NO. : _____________________
The following bar graph shows the top speed different cars can
attain. Fill in the blanks with the help of the Bar graph.
200
180
160
140
120
100
80
60
40
20
0
Maruti 800
Santro
SX4
Verna
Lancer
Honda City
BMW
MODEL
(a)
The fastest cars are _________ and _________. They can attain a
top speed of _________ km/hr.
(b)
The slowest car is _________ with a top speed of _________
km/hr.
(c)
The top speed of _________ is 45 km/hr less than that of the SX4.
(d)
The _________ has a top speed of 30 km/hr more than that of the
Verna.
(e)
The top speed of Honda City is 15 km/hr_________ than that of
SX4.
(f)
The Maruti 800 is _________ km/hr slower than the Lancer and
BMW.
ADVERTISEMENT
0 votes
Related Articles
Related forms


Related Categories
Parent category: Education