Writing Linear Equations Worksheet Page 19
ADVERTISEMENT
 1
1 2
2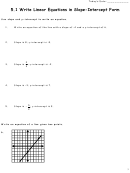 3
3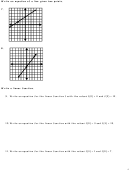 4
4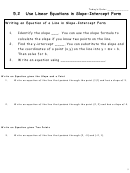 5
5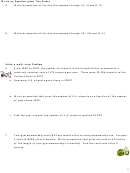 6
6 7
7 8
8 9
9 10
10 11
11 12
12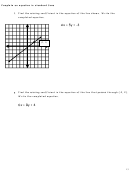 13
13 14
14 15
15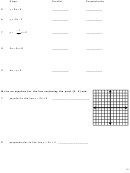 16
16 17
17 18
18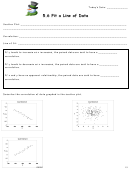 19
19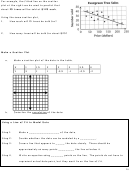 20
20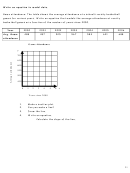 21
21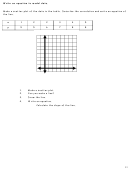 22
22 23
23 24
24Today’s Date: ____________
5.6 Fit a Line of Data
Scatter Plot: _____________________________________________________________
_______________________________________________________________________
Correlation: ______________________________________________________________
Line of fit: _______________________________________________________________
If y tends to increase as x increases, the paired data are said to have a ___________
correlation.
If y tends to decrease as x increases, the paired data are said to have a ___________
correlation.
If x and y have no apparent relationship, the paired data are said to have ___________
correlation.
Describe the correlation of data graphed in the scatter plot.
19
ADVERTISEMENT
0 votes
Related Articles
Related forms


Related Categories
Parent category: Education