Writing Linear Equations Worksheet Page 20
ADVERTISEMENT
 1
1 2
2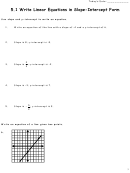 3
3 4
4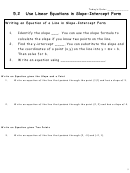 5
5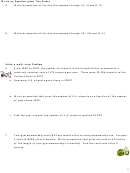 6
6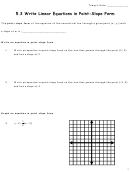 7
7 8
8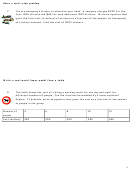 9
9 10
10 11
11 12
12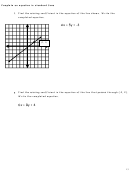 13
13 14
14 15
15 16
16 17
17 18
18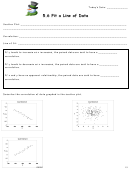 19
19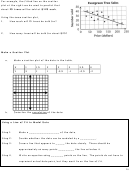 20
20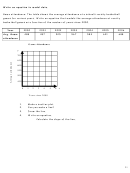 21
21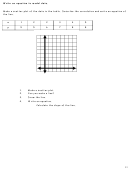 22
22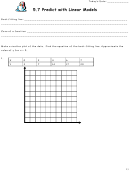 23
23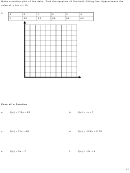 24
24For example, the fitted line on the scatter
plot at the right can be used to predict that
about 25 trees will be sold at $125 each.
Using the same scatter plot,
1.
How much will 15 trees be sold for?
2.
How many trees will be sold for about $25?
Make a Scatter Plot
a.
Make a scatter plot of the data in the table.
X
1
1.5
2
2
3
3.5
4
Y
3
1
1
-0.5
-1
-0.5
-2
b.
Describe the correlation of the data:
Using a Line of Fit to Model Data
Step 1:
Make a _________________ of the data.
Step 2:
Decide whether the data can be modeled by a _________.
Step 3:
Draw a line that appears to _____ the data closely. There should be
approximately as many points _________ the line as below it.
Step 4.
Write an equation using _______ points on the line. The points do not have to
represent actual data pairs, but they must lie on the line of fit.
20
ADVERTISEMENT
0 votes
Related Articles
Related forms


Related Categories
Parent category: Education