Pie Charts Worksheet With Answers - Grade 7, Muhammad Javed Iqbal
ADVERTISEMENT
 1
1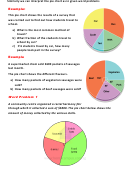 2
2 3
3 4
4 5
5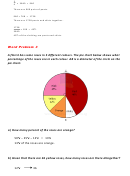 6
6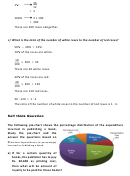 7
7 8
8 9
9 10
10 11
11 12
12Pie Charts: Practice Problems Grade 7
A
pie chart
(also called a Pie Graph or Circle Graph) makes use of sectors in a
circle. The angle of a sector is proportional to the frequency of the data.
The formula to determine the angle of a sector is:
���������� ���� ������������
��
���������� ���� ������������ =
× ������
���������� ����������
Study the following steps of constructing a circle graph:
Step 1 :
Calculate the angle of each sector, using the formula
Step 2
: Draw a circle using a pair of compasses
Step 3
: Use a protractor to draw the angle for each sector.
Step 4 :
Label the circle graph and all its sectors.
Example:
In a school, there are 750 students in Year1, 420 students in Year 2 and 630
students in Year 3. Draw a circle graph to represent the numbers of students in
these groups.
Solution:
Total number of students = ������ + ������ + ������ = ��, ������.
������
��
�������� �� �������� ���� ���������� =
× ������
��������
��
= ������
������
��
�������� �� �������� ���� ���������� =
× ������
��������
��
= ����
������
��
�������� �� �������� ���� ���������� =
× ������
��������
��
= ������
ADVERTISEMENT
0 votes
Related Articles
Related forms


Related Categories
Parent category: Education