Pie Charts Worksheet With Answers - Grade 7, Muhammad Javed Iqbal Page 10
ADVERTISEMENT
 1
1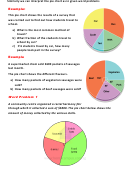 2
2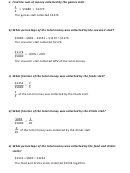 3
3 4
4 5
5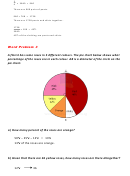 6
6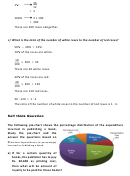 7
7 8
8 9
9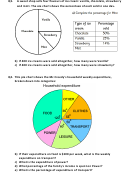 10
10 11
11 12
12Q3.
A sweet shop sells four flavours of ice cream: vanilla, chocolate, strawberry
and mint. The pie chart shows the percentage of each sold in one day.
b) If 400 ice creams were sold altogether, how many were Vanilla?
c) If 400 ice creams were sold altogether, how many were strawberry?
Q4. This pie chart shows the Mc Creedy's household weekly expenditure,
broken down into categories:
b) If their expenditure on food is $300 per week, what is the weekly
expenditure on transport?
c) What is the expenditure of power?
d) What percentage of the family's income is spent on Power?
e) What is the percentage of expenditure of transport?
ADVERTISEMENT
0 votes
Related Articles
Related forms


Related Categories
Parent category: Education