Data Handling Worksheets - Level 2, International School Of Madrid Page 39
ADVERTISEMENT
 1
1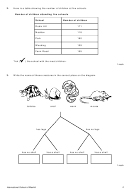 2
2 3
3 4
4 5
5 6
6 7
7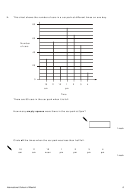 8
8 9
9 10
10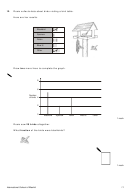 11
11 12
12 13
13 14
14 15
15 16
16 17
17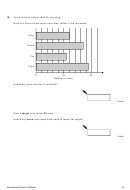 18
18 19
19 20
20 21
21 22
22 23
23 24
24 25
25 26
26 27
27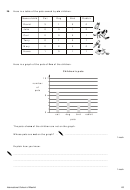 28
28 29
29 30
30 31
31 32
32 33
33 34
34 35
35 36
36 37
37 38
38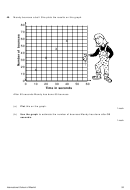 39
39 40
40 41
41 42
42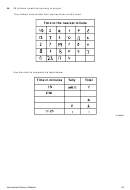 43
43 44
44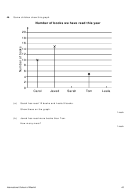 45
45 46
46 47
47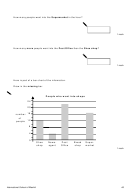 48
4840.
Mandy bounces a ball. She plots the results on this graph.
80
70
60
X
50
X
40
X
30
20
X
10
X
0
0
10
20
30
40
50
60
Time in seconds
After 50 seconds Mandy has done 65 bounces.
(a)
Plot this on the graph.
1 mark
(b)
Use the graph to estimate the number of bounces Mandy has done after 35
seconds.
1 mark
International School of Madrid
39
ADVERTISEMENT
0 votes
Related Articles
Related forms


Related Categories
Parent category: Business