Background Radiation Physics Worksheets
ADVERTISEMENT
 1
1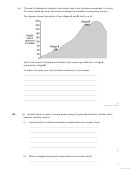 2
2 3
3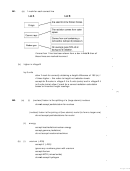 4
4 5
5 6
6Q1.
The pie chart shows the average proportions of background radiation from various sources
in the UK.
(a)
Three sources of background radiation are given in List A.
Statements about sources of background radiation are given in List B.
Draw one line to link each source of background radiation in List A to the statement about
that source given in List B.
Draw only three lines.
List A
List B
Are used to show broken bones.
X-rays
The radiation comes from outer
space.
Cosmic rays
Comes from soil containing a
radioactive isotope of potassium.
Radon gas
On average gives 50% of all
background radiation.
(3)
Page 1 of 6
ADVERTISEMENT
0 votes
Related Articles
Related forms

")


Related Categories
Parent category: Education