Blitzer 2.4 Math 152 Linear Functions Slope Worksheet Page 7
ADVERTISEMENT
 1
1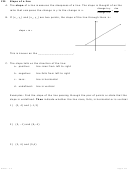 2
2 3
3 4
4 5
5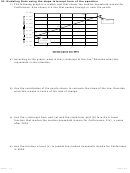 6
6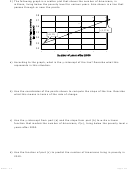 7
72) The following graph is a scatter plot that shows the number of Americans, in
millions, living below the poverty level for various years. Also shown is a line that
passes through or near the points.
38
37
37
37
35.9
36
(5, 37.0)
34.6
35
(0, 33)
34
32.9
33
32
0
1
2
3
4
5
Number of years after 2000
a) According to the graph, what is the y-intercept of the line? Describe what this
represents in this situation.
b) Use the coordinates of the points shown to compute the slope of the line. Describe
what this means in terms of the rate of change.
c) Use the y-intercept from part (a) and the slope from part (b) to write a linear
function that models the number of Americans, P(x), living below the poverty level x
years after 2000.
d) Use the function of part (c) to predict the number of Americans living in poverty in
2010.
Blitzer — 2.4
Page 7 of 7
ADVERTISEMENT
0 votes
Related Articles
Related forms


 Worksheet Template With Answer Key")
 Worksheet Template With Answer Key")
 Worksheet Template With Answer Key")
 Worksheet Template With Answer Key")
 Worksheet Template With Answer Key")
 Worksheet Template With Answer Key")
 Worksheet Template With Answer Key")
Related Categories
Parent category: Education