Concavity And The Second Derivative Test Worksheet With Answers Page 5
ADVERTISEMENT
 1
1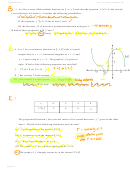 2
2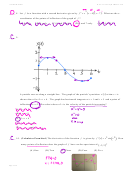 3
3 4
4 5
5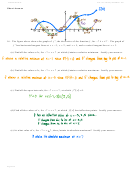 6
6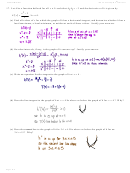 7
7 8
8 9
9nd
Calculus Maximus
WS 3.4: Concavity & 2
Deriv Test
_____14.
( )
′
The graph of
f x
The figure above shows the graph of f ′ , the derivative of function f , for 8
− < < . Of the
x
6
following, which best describes the graph of f on the same interval?
(A) 1 local minimum, 1 local maximum, and 3 inflection points
(B) 1 local minimum, 1 local maximum, and 4 inflection points
(C) 2 local minima, 1 local maximums, and 2 inflection points
(D) 2 local minima, 1 local maximum, and 4 inflection points
(E) 2 local minima, 2 local maxima, and 3 inflection points
_____ 15.
( )
The graph of a differentiable function
f x is shown in the figure above and has an inflection point
3
( )
( )
( )
f ′
f ′′
x = . Which of the following correctly orders
at
f
2
,
2
, and
2
?
2
( )
( )
( )
′
′′
<
<
(A)
f
2
f
2
f
2
( )
( )
( )
′
′′
<
<
(B)
f
2
f
2
f
2
( )
( )
( )
′
′′
<
<
(C)
f
2
f
2
f
2
( )
( )
( )
′′
′
<
<
(D)
f
2
f
2
f
2
( )
( )
( )
′′
′
<
<
(E)
f
2
f
2
f
2
Page 5 of 9
ADVERTISEMENT
0 votes
Related Articles
Related forms


Related Categories
Parent category: Education