Concavity And The Second Derivative Test Worksheet With Answers Page 6
ADVERTISEMENT
 1
1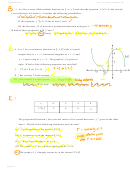 2
2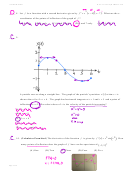 3
3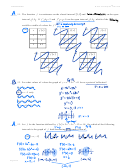 4
4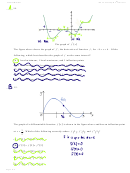 5
5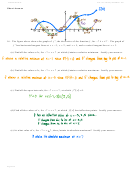 6
6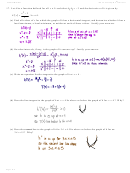 7
7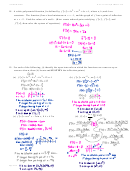 8
8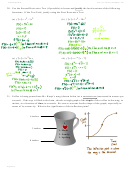 9
9nd
Calculus Maximus
WS 3.4: Concavity & 2
Deriv Test
Short Answer
16. The figure above shows the graph of f ′ , the derivative of the function f , for 7
− ≤ ≤ . The graph of
x
7
f ′ has horizontal tangent lines at
x = − ,
x = , and
x = , and a vertical tangent line at
x = .
3
2
5
3
− < < , at which f attains a relative minimum. Justify your answer.
(a) Find all the values of x, for 7
x
7
− < < , at which f attains a relative maximum. Justify your answer.
(b) Find all the values of x, for 7
x
7
( )
′′
< .
− < < , at which
(c) Find all the open intervals, for 7
x
7
f
x
0
( )
− < < , at which
(d) Find all the values of x, for 7
x
7
f x has inflection points. Justify your answers.
− < < , does f attain its absolute maximum? Justify your answer.
(e) At what value of x, for 7
x
7
Page 6 of 9
ADVERTISEMENT
0 votes
Related Articles
Related forms


Related Categories
Parent category: Education