Understanding Graphs Of Linear Equations Worksheet With Answers
ADVERTISEMENT
 1
1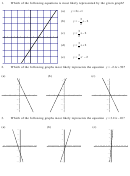 2
2 3
3UNDERSTANDING GRAPHS OF LINEAR EQUATIONS
=
+
Recall that the slope-intercept form of a linear equation is
where m is the
y
mx
b
slope and b is the y-coordinate of the y-intercept
−
=
−
Recall that the point-slope of a linear equation is
where m is the slope
y
y
m
(
x
x
)
0
0
and
is a given point on the line
(
x
,
y
)
0
0
Don’t forget that the slope measures the change in the y-coordinate relative to the
∆
change
in
y
y
=
=
change in the x-coordinate, or, more precisely, slope
∆
change
in
x
x
Model Problems:
1.
What are the slope and the y-intercept of the following linear equation?
+
=
−
6
x
2
2
y
7
= x
3 +
Solve the original equation for y and read off m and b
y
4
5 .
=
=
Answer:
and y-int
m
3
0 (
. 4 ,
) 5
(
)
(
)
2.
Find the slope of the line which passes through the points
and
.
, 5
100
, 8
67
−
100
67
33
=
=
=
−
Answer:
slope
11
−
−
5
8
3
(
)
(
)
3.
Find the equation of the line which passes through the points
and
.
, 5
100
, 8
67
=
−
Using the above result, we know that
m
11
−
=
−
−
Here we’re using the point-slope form
y
100
11
(
x
) 5
−
=
−
+
−
Distribute
y
100
11
x
55
11
=
−
11 +
Solve for y
y
x
155
4.
Find an equation of the line graphed on the right:
6
=
−
Choose any two clear points, like (2, 0)
m
2
and (0, 4), and use the slope formula
4
y-int = (0, 4)
Simply read off the graph
2
=
−
2 +
Answer:
y
x
4
-2
2
4
Practice Exercises:
ADVERTISEMENT
0 votes
Related Articles
Related forms


Related Categories
Parent category: Education