Understanding Graphs Of Linear Equations Worksheet With Answers Page 2
ADVERTISEMENT
 1
1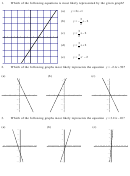 2
2 3
31.
Which of the following equations is most likely represented by the given graph?
4
= x
2 +
(a)
y
1
3
3
=
−
−
(b)
y
x
2
2
2
1
3
=
−
(c)
y
x
2
2
-4
-2
2
4
-1
3
=
+
(d)
y
x
2
2
-2
3
=
−
-3
2
(e)
y
x
2
2
-4
=
−
+
2.
Which of the following graphs most likely represents the equation
?
y
2
1 .
x
50
(a)
(b)
(c)
60
60
60
40
40
40
20
20
20
-60
-40
-20
20
40
60
-60
-40
-20
20
40
60
-60
-40
-20
20
40
60
-20
-20
-20
-40
-40
-40
-60
-60
-60
=
−
3.
Which of the following graphs most likely represents the equation
?
y
. 3
11
x
10
(a)
(b)
(c)
30
30
20
15
20
20
10
10
10
5
-30
-20
-10
10
20
30
-30
-20
-10
10
20
30
-20
-10
10
20
-5
-10
-10
-10
-20
-20
-15
-30
-30
-20
ADVERTISEMENT
0 votes
Related Articles
Related forms


Related Categories
Parent category: Education