Break Even Analysis Financial Math Worksheet Page 2
ADVERTISEMENT
 1
1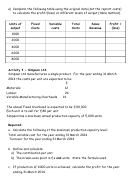 2
2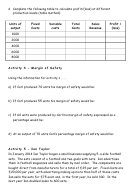 3
3 4
4 5
5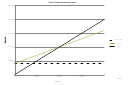 6
6 7
7 8
8 9
9 10
10e) Complete the following table using the original data (not the reprint costs)
to calculate the profit/(loss) at different levels of output (table method).
Units of
Fixed
Variable
Total
Sales
Profit /
output
Costs
costs
Costs
Revenue
(loss)
1000
2000
4000
6000
8000
Activity 3 - Simpson Ltd
Simpson Ltd manufactures a single product. For the year ending 31 March
2014 the costs per unit are expected to be:
£
Materials
12
Labour
24
Variable Manufacturing Overheads
14
The annual Fixed Overhead is expected to be £90,300.
Each unit is to sell for £80 per unit
Simpson has a maximum annual production capacity of 5,000 units.
Required:
a. Calculate the following at the maximum production capacity level:
Total variable cost for the year ending 31 March 2014
Turnover for the year ending 31 March 2014
b. Define and calculate:
a) The contribution per unit
b) The break-even point in £s and units. State the formula used
c. If production of 4000 units is achieved, calculate the profit for the year
ending 31 March 2014.
ADVERTISEMENT
0 votes
Related Articles
Related forms


Related Categories
Parent category: Education