Break Even Analysis Financial Math Worksheet Page 6
ADVERTISEMENT
 1
1 2
2 3
3 4
4 5
5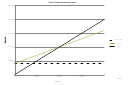 6
6 7
7 8
8 9
9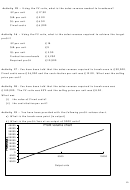 10
10Price, Porter Break-even chart
250000
200000
150000
Fixed costs
total costs
revenue
100000
50000
0
0
10000
20000
30000
40000
Output
ADVERTISEMENT
0 votes
Related Articles
Related forms


Related Categories
Parent category: Education