Graphs Worksheet With Answers - Mphoweh Jude & Futonge Kisito Page 2
ADVERTISEMENT
 1
1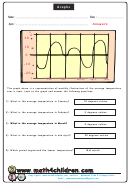 2
2Graphs
Name : .................................................................................. Class : ..............................
Answers
Score : ...............................................................................................
0
C
20
10
0
-10
-20
0
May
Jan
Feb
March
April
The graph above is a representation of monthly fluctuations of the average temperature
over a town. Look at the graph and answer the following questions:
10 degrees celcius
1) What is the average temperature in January?
0 degrees celcius
2) What is the average temperature in Febuary?
3) What is the average temperature in March?
What is the average temperature in March?
0 degrees celcius
4) What is the average temperature in mid April?
20 degrees celcius
5) Which period registered the lowest temperature?
Mid march
3
+
1
Copy rights: , Authors . Mphoweh Jude & Futonge Kisito
Email :
ADVERTISEMENT
0 votes
Related Articles
Related forms


Related Categories
Parent category: Education