Graphing Exponential Functions Worksheet With Answers Page 4
ADVERTISEMENT
 1
1 2
2 3
3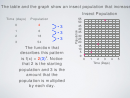 4
4 5
5 6
6 7
7 8
8 9
9 10
10The table and the graph show an insect population that increase
Insect Population
Time (days)
Population
55
50
0
2
• 3
45
40
1
6
• 3
35
2
18
30
• 3
25
3
54
20
15
The function that
10
5
describes this pattern
0
x
is f(x) =
2(3)
. Notice
0
1
2
3
4
5
Time (Days)
that 2 is the starting
population and 3 is the
amount that the
population is multiplied
by each day.
ADVERTISEMENT
0 votes
Related Articles
Related forms


 - Function Worksheet With Answers")

Related Categories
Parent category: Education