Quadratic Functions Worksheet - Chapter 2
ADVERTISEMENT
 1
1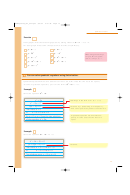 2
2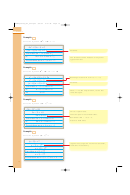 3
3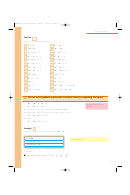 4
4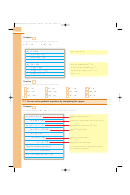 5
5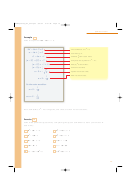 6
6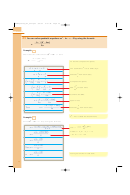 7
7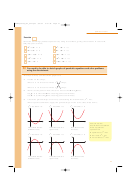 8
8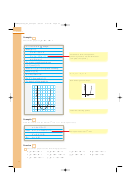 9
9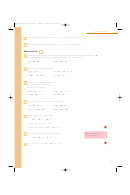 10
10 11
1102Chapter02_014_024.qxd
3/9/04
9:31 am
Page 14
2
2
Quadratic functions
This chapter shows you how to draw, sketch and solve quadratic equations.
2.1
You need to be able to plot graphs of quadratic equations.
The general form of a quadratic equation is
2
y
a
x
b
x
c
where a, b and c are constants and a
0.
x
x
2
x
This could also be written as f(
)
a
b
c.
Example
1
y
x
2
x
x
a Draw the graph with equation
3
4 for values of
from
2 to
5.
y
x
b Write down the minimum value of
and the value of
for this point.
c Label the line of symmetry.
a
x
2
1
0
1
2
3
4
5
1 First draw a table of values.
Remember any number squared is positive.
2
x
4
1
0
1
4
9
16 25
3x
6
3
0
3
6
9
12
15
4
4
4
4
4
4
4
4
4
y
6
0
4
6
6
4
0
6
2 Look at the table to determine the
y
y
extent of the
-axis. Use values of
from
6 to
6.
y
6
1.5
x
5
4
3
3 Plot the points and then join all the
2
points together with a smooth curve.
1
The general shape of the curve is a
, it
0
x
is called a parabola.
2
1
1
2
3
4 5
1
This is the line of symmetry. It is always
2
x
half-way between the
-axis crossing
3
x
points. It has equation
1.5.
4
This is the minimum.
5
6
Minimum value is y
6.3 when x
b
1.5.
c
See graph.
14
ADVERTISEMENT
0 votes
Related Articles
Related forms
 Chapter 4 Notes Packet On Quadratic Functions And Factoring Worksheet With Answers - Algebra 2
Education
Chapter 4 Notes Packet On Quadratic Functions And Factoring Worksheet With Answers - Algebra 2
Education


 Vertex Form Of Quadratic Functions Worksheet - Unit 2, Chino Valley Unified School District
Education
Vertex Form Of Quadratic Functions Worksheet - Unit 2, Chino Valley Unified School District
Education


Related Categories
Parent category: Education