Ogt Math Study Guide Worksheet With Answers - Maple Heights City Schools Page 15
ADVERTISEMENT
 1
1 2
2 3
3 4
4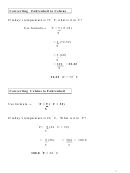 5
5 6
6 7
7 8
8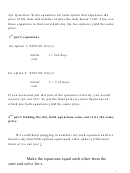 9
9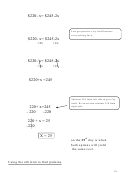 10
10 11
11 12
12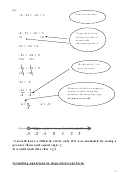 13
13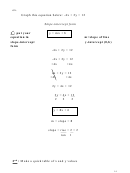 14
14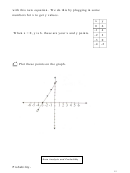 15
15 16
16 17
17 18
18 19
19 20
20 21
21 22
22 23
23 24
24 25
25 26
26 27
27 28
28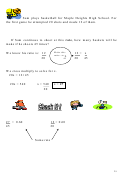 29
29 30
30 31
31with this new equation. We do this by plugging in some
numbers for x to get y values.
x
y
0
6
-1 4
When x = 0, y is 6. these are your x and y points.
-2 2
-3 0
-4 -2
rd
3
: Plot these points on the graph.
Data Analysis and Probability
Probability-
15
ADVERTISEMENT
0 votes
Related Articles
Related forms


Related Categories
Parent category: Education