Ogt Math Study Guide Worksheet With Answers - Maple Heights City Schools Page 19
ADVERTISEMENT
 1
1 2
2 3
3 4
4 5
5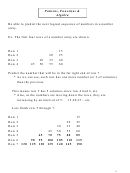 6
6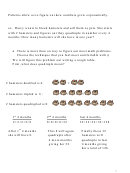 7
7 8
8 9
9 10
10 11
11 12
12 13
13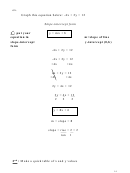 14
14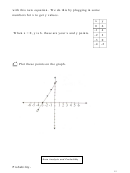 15
15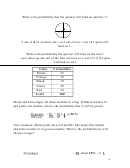 16
16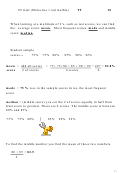 17
17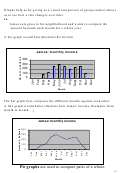 18
18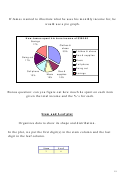 19
19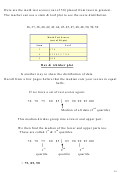 20
20 21
21 22
22 23
23 24
24 25
25 26
26 27
27 28
28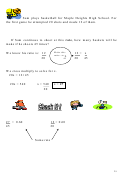 29
29 30
30 31
31If James wanted to illustrate what he uses his monthly income for, he
would use a pie graph.
How James spent his June income of $300.00
Savings
17%
Clothes &
shoes
Clothes & shoes
33%
Gas & supplies
Going out
Music
17%
Cell phone
Going out
Gas &
Cell phone
Savings
supplies
Music
13%
10%
10%
Bonus question: can you figure out how much he spent on each item
given the total income and the %’s for each.
Stem and Leaf plot
Organizes data to show its shape and distribution
.
In the plot, we put the first digit(s) in the stem column and the last
digit in the leaf column.
Stem
Leaf
3
6
19
ADVERTISEMENT
0 votes
Related Articles
Related forms


Related Categories
Parent category: Education