The Graph Of A Quadratic Function (Day 1) Examples And Worksheet - Algebra Unit 11-Graphing Quadratics Page 13
ADVERTISEMENT
 Examples And Worksheet - Algebra Unit 11-Graphing Quadratics Printable pdf") 1
1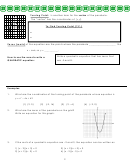 2
2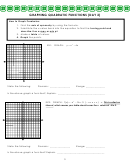 3
3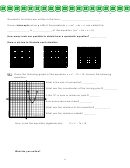 4
4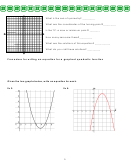 5
5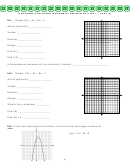 6
6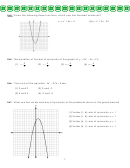 7
7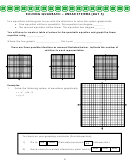 8
8 9
9 10
10 11
11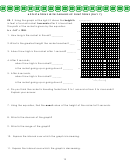 12
12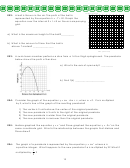 13
13 14
14 15
15height (meters)
EX2: A ball is thrown in the air. The path of the ball is
represented by the equation h = -t
+ 8t. Graph the
2
equation over the interval 0 t 8 on the accompanying
grid.
a) What is the maximum height of the ball?__________
b) What is the amount of time that the ball is
above 7 meters? ________________
time (seconds)
EX3: A swim team member performs a dive from a 14-foot high springboard. The parabola
below shows the path of her dive.
a) What is the axis of symmetry? _________
b) Find f(6) _______________________
EX4: Consider the graph of the equation y = ax +bx + c, when a
0. If a is multiplied
by 3, what is true of the graph of the resulting parabola?
1) The vertex is 3 units above the vertex of the original parabola.
2) The new parabola is 3 units to the right of the original parabola
3) The new parabola is wider than the original parabola.
4) The new parabola is narrower than the original parabola.
EX5: Melissa graphed the equation y = x
and Dave graphed the equation y = -3x
on the
2
2
same coordinate grid. What is the relationship between the graphs that Melissa and
Dave drew?
EX6:
The graph of a parabola is represented by the equation y = ax
where a is
2
a positive integer. What happens to the new parabola if a is multiplied by 2? What if
1
multiplied by
?
2
13
ADVERTISEMENT
0 votes
Related Articles
Related forms

 Worksheet")


 Form Of A Quadratic Worksheet")


 Chord Chart")

Related Categories
Parent category: Education