The Graph Of A Quadratic Function (Day 1) Examples And Worksheet - Algebra Unit 11-Graphing Quadratics Page 3
ADVERTISEMENT
 Examples And Worksheet - Algebra Unit 11-Graphing Quadratics Printable pdf") 1
1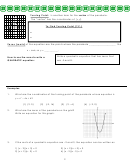 2
2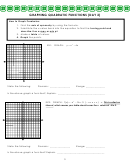 3
3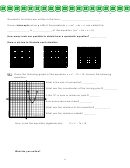 4
4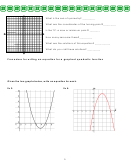 5
5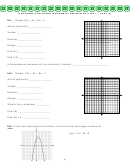 6
6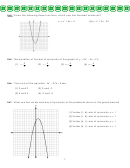 7
7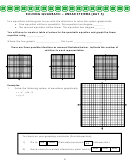 8
8 9
9 10
10 11
11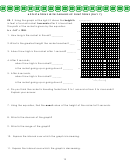 12
12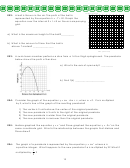 13
13 14
14 15
15GRAPHING QUADRATIC FUNCTIONS (DAY 2)
How to Graph Parabolas:
1. Find the axis of symmetry by using the formula.
2. Substitute the x-value back into the equation to find the turning point and
describe it as a max or min pt.
3. Make a table of values.
4. Graph the points.
2
EX1: GRAPH:
y
x
4x
State the following:
Domain: ________________
Range: _______________
Is the above graph a function?, Explain. _____________________________________
EX2: GRAPH:
f(x)
x
2
2x
3
(
4
x
2
)
This is called an
interval, which means your table should cover the x values of -4 to 2.
State the following:
Domain: ________________
Range: _______________
Is the above graph a function? Explain. _____________________________________
3
ADVERTISEMENT
0 votes
Related Articles
Related forms

 Worksheet")


 Form Of A Quadratic Worksheet")


 Chord Chart")

Related Categories
Parent category: Education