15 Relative Frequency And Probability Examples And Worksheets - Maths Quest General Maths Preliminary Course Page 7
ADVERTISEMENT
 1
1 2
2 3
3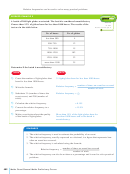 4
4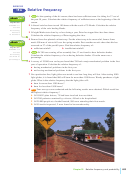 5
5 6
6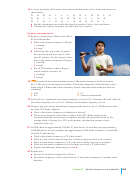 7
7 8
8 9
9 10
10 11
11 12
12 13
13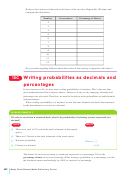 14
14 15
15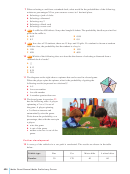 16
16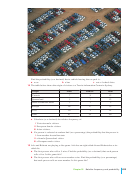 17
17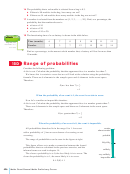 18
18 19
19 20
20 21
21 22
22 23
23 24
24 25
25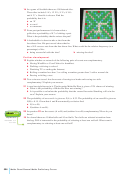 26
26 27
27 28
28 29
29 30
3016
A soccer team plays 40 matches over a season and the results (wins, losses and draws) are
shown below.
W
W
W
D
L
L
L
D
W
L
W
D
L
D
W
W
L
L
L
D
W
W
D
L
L
W
W
W
L
D
L
D
D
L
W
W
W
D
D
L
a
Put this information into a table showing the number of wins, losses and draws.
b
Calculate the relative frequency of each result over a season.
Further development
17
Roger is a tennis player. He has won 165 of
his last 200 matches.
a
What is the relative frequency of Roger:
i
winning?
ii
losing?
b
After Roger has some time off tennis
he comes back and wins only 6 of his
next 20 matches. For this period of time
what is the relative frequency of Roger:
i
winning?
ii
losing?
c
For all 220 matches, what is Roger’s
overall relative frequency of:
i
winning?
ii
losing?
18
A biased coin is tossed a number of times. The relative frequency of tails is found to
MC
be 0.2. The coin is tossed again several times. The relative frequency of tails this time is now
found to be 0.3. What is the relative frequency of tails, when the results of the two trials are
combined?
A
0.25
B
0.5
C
D
0.6
cannot be determined
19
In 60 rolls of a standard die, the relative frequency of a six is 0.2. In another 100 rolls of the die
the relative frequency of a six is 0.3. Find the overall relative frequency of a six.
20
During a one-year period, an insurance company finds that in a city of 125 000 homes, there
has been 1275 home robberies.
a
What is the relative frequency of robberies in the city?
b
The average insurance claim after a robbery is $14 250. When setting home
insurance premiums the insurance company calculates the premiums based on this
average claim. Allowing for a 25% profit margin, calculate the amount of each
premium in the city.
21
In NSW there are approximately 250 000 ‘P’ plate drivers. In total there are approximately
3 000 000 drivers. In one year there was approximately 5 000 traffic accidents, of which 800
involved ‘P’ plate drivers.
a
What is the relative frequency of ‘P’ plate drivers?
b
What was the overall relative frequency of drivers being involved in an accident?
c
What was the relative frequency of ‘P’ plate drivers being involved in accidents?
d
What was the relative frequency of an accident involving a ‘P’ plate driver?
e
c
and d.
Explain the difference between parts
22
Explain why:
a
the sum of all relative frequencies will be 1
b
the relative frequency of one event increases, if the relative frequency of another event
decrease.
485
Chapter 15
Relative frequency and probability
ADVERTISEMENT
0 votes
Related Articles
Related forms


Related Categories
Parent category: Education