Statistics Worksheet - Relative Frequency Histogram
ADVERTISEMENT
 1
1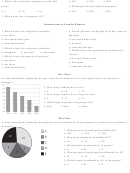 2
2IB Math Studies Statistics Worksheet D
Relative Frequency Histogram
Name _____________________________________________________ Date _____________
Use the histogram below showing the frequency for the number of text messages in one day for a group of
50 students for questions 1 through 5.
3. Which interval has a frequency of 8?
a. 0 to 4
b. 4 to 8
c. 12 to 16
4. Which interval has a relative frequency of
0.20?
1. The first interval is 0 to 4, that is 0 ≤ x < 4.
a. 0 to 4
b. 4 to 8
c. 12 to 16
5. If the histogram were changed to a relative
What is the frequency for the interval 4 to 8?
frequency histogram, which of these would
a. 10
b. 12
c. 15
change?
2. What is the relative frequency for the interval
a. width of the rectangles
b. scale on
16 to 20?
the x-axis
c. scale on the y-axis
a. 0.12
b. 0.16
c. 0.24
Use the table below showing the frequencies for the ages of 50 persons attending a dolphin show at the zoo
for questions 6 through 9.
6. What is the frequency for 30-40?
a. 0.10
b. 5
c. 28
7. What is the cumulative frequency for 20-30?
a. 6
b. 17
c. 23
8. What is the relative frequency for 40-50?
a. 0.20
b. 0.76
c. 10
9. What is the cumulative relative frequency for 10-20?
a. 0.09
b. 0.18
c. 0.34
Frequency Polygon
Use the frequency polygon below showing the number of tickets, which vary by price depending on seat
location, sold for one day concert tickets for questions
1 through 4.
1. What is the frequency for the $20 price?
a. 4
b. 5
c. 11
ADVERTISEMENT
0 votes
Related Articles
Related forms


Related Categories
Parent category: Education