Easter Bar Graph (E) Worksheet With Answer Key
ADVERTISEMENT
 Worksheet With Answer Key Printable pdf") 1
1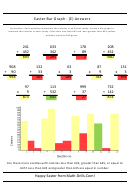 2
2Easter Bar Graph - (E)
Instruction : Each question represents the calories in an Easter candy. Create a bar graph to
compare the calories in each candy. Color bars less than 645 red, bars greater than 645 yellow,
and bars equal to 645 green.
241
633
178
208
+ 452
-
342
÷
89
+ 452
908
132
63
87
131
+
90
+
33
x
3
x
9
x
3
97
113
999
732
x
9
+
532
÷
37
+ 142
Question no.
Are there more candies with calories less than 645, greater than 645, or equal to
645?
Happy Easter from Math-Drills.Com!
ADVERTISEMENT
0 votes
Related Articles
Related forms
 Worksheet With Answer Key")
 Worksheet With Answer Key")
 Worksheet With Answer Key")


 Worksheet With Answer Key")
Related Categories
Parent category: Education