Graphing Linear Equations In Standard Form Worksheets Page 2
ADVERTISEMENT
 1
1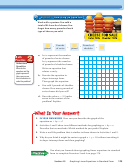 2
2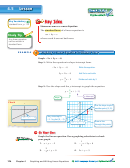 3
3 4
4 5
5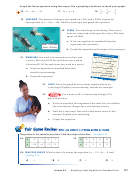 6
62 2
ACTIVITY:
Rewriting an Equation
Work with a partner. You sold a
total of $16 worth of cheese. You
forgot how many pounds of each
type of cheese you sold.
⋅
⋅
Pounds
Pounds of
+
=
—
—
pound
of swiss
pound
cheddar
a. Let x represent the number
Math
y
of pounds of swiss cheese.
Practice
9
Let y represent the number
Understand
8
of pounds of cheddar cheese.
Quantities
Write an equation that
7
What do the
relates x and y.
equation and the
6
graph represent?
b. Rewrite the equation in
How can you use
5
slope-intercept form.
this information to
4
solve the problem?
Then graph the equation.
3
c. You sold 2 pounds of cheddar
cheese. How many pounds of
2
swiss cheese did you sell?
1
d. Does the value x = 2.5 make
0
sense in the context of the
0
1
2
3
4
5
6
7
8
9
x
problem? Explain.
3.
IN YOUR OWN WORDS
How can you describe the graph of the
equation ax + by = c ?
4. Activities 1 and 2 show two different methods for graphing ax + by = c.
Describe the two methods. Which method do you prefer? Explain.
5. Write a real-life problem that is similar to those shown in Activities 1 and 2.
6. Why do you think it might be easier to graph x + y = 10 without rewriting it
in slope-intercept form and then graphing?
Use what you learned about graphing linear equations in standard
form to complete Exercises 3 and 4 on page 176.
Section 4.5
Graphing Linear Equations in Standard Form
173
ADVERTISEMENT
0 votes
Related Articles
Related forms


Related Categories
Parent category: Education