Graphing Linear Equations In Standard Form Worksheets Page 4
ADVERTISEMENT
 1
1 2
2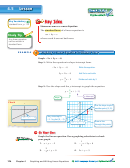 3
3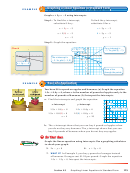 4
4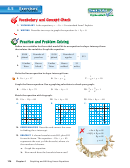 5
5 6
6Graphing a Linear Equation in Standard Form
2 2
EXAMPLE
Graph x + 3y = −3 using intercepts.
Step 1: To fi nd the x-intercept,
To fi nd the y-intercept,
substitute 0 for y.
substitute 0 for x.
x +
= −3
+ 3y = −3
3y
x
x + 3(0) = −3
+ 3y = −3
0
x = −3
y = −1
Step 2: Graph the equation.
The y-intercept is
y
Check
x
3y
3
2
2
1. So, plot (0, 1).
1
( 3, 0)
4
4
2
3
4
x
The x-intercept is
(0,
1)
3. So, plot ( 3, 0).
x
3y
3
3
4
Draw a line
5
6
through the points.
6
Real-Life Application
3 3
EXAMPLE
You have $6 to spend on apples and bananas. (a) Graph the equation
1.5x + 0.6y = 6, where x is the number of pounds of apples and y is the
number of pounds of bananas. (b) Interpret the intercepts.
a. Find the intercepts and graph the equation.
y
12
(0, 10)
x-intercept
y-intercept
10
8
1.5x +
= 6
+ 0.6y = 6
1.5x
0.6y
6
0.6y
1.5x
6
1.5x + 0.6(0) = 6
1.5(0) + 0.6y = 6
4
x = 4
y = 10
2
(4, 0)
1
2
3
4
5
6
x
b. The x-intercept shows that you can buy 4 pounds of apples when
you do not buy any bananas. The y-intercept shows that you can
buy 10 pounds of bananas when you do not buy any apples.
Graph the linear equation using intercepts. Use a graphing calculator
to check your graph.
Exercises 16 – 18
5. 2x − y = 8
x + 3y = 6
6.
7.
WHAT IF?
In Example 3, you buy y pounds of oranges instead
of bananas. Oranges cost $1.20 per pound. Graph the equation
1.5x + 1.2y = 6. Interpret the intercepts.
Section 4.5
Graphing Linear Equations in Standard Form
175
ADVERTISEMENT
0 votes
Related Articles
Related forms


Related Categories
Parent category: Education