Data Collection Form Worksheet - Northern Oklahoma College Page 2
ADVERTISEMENT
 1
1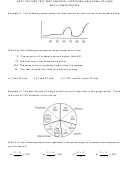 2
2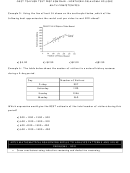 3
3 4
4 5
5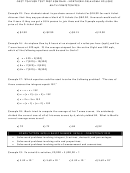 6
6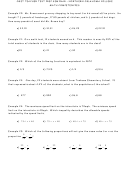 7
7 8
8 9
9 10
10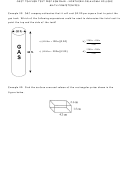 11
11OGET TEACHER TEST PREP SEMINAR – NORTHERN OKLAHOMA COLLEGE
MATH COMPETENCIES
Example 3: The following graph shows the distribution of test scores on an Algebra Exam.
Which of the following statements do you know to be true?
I. The majority of students scored higher than 60?
II. The test was a fair measure of ability.
III. The mean score is probably higher than the median.
IV. The test divided the class into distinct groups.
a) I and II only
b) I and IV only
c) I, III, and IV only d) IV only
Example 4: The distribution of a high school chorus is depicted in the graph below. There
is a total of 132 students in the chorus.
Which of the following expression represents the percentage of freshman and sophomore
girls in chorus?
21 15
21 15
21 15
21 15
a)
x 100
b)
+ 100
c)
d)
x 132
132
132
132
132
ADVERTISEMENT
0 votes
Related Articles
Related forms


")


Related Categories
Parent category: Business