4.1 Worksheet: Graphing Linear Equations Worksheet Page 2
ADVERTISEMENT
 1
1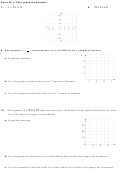 2
2Solve for y. Then graph the equation.
y
2
x
5
2
x
+ y
3
6
7.
8.
−
=
=
1
The equation
represents the cost y (in dollars) for x pounds of bananas.
y
x
9.
=
2
4
Graph the equation.
a.
3
2
1
7
1
5
3
Use the graph to estimate the cost of 7 pounds of bananas.
b.
Use the equation to find the exact cost of 7 pounds of bananas.
c.
The equation
y
2
5 .
x
35
represents the cost y (in dollars) of the family meal when the food
10.
=
+
costs $35 and x beverages are purchased.
Graph the equation.
a.
50
40
30
0
6
2
4
Use the graph to estimate the cost of the family meal when 5 beverages are purchased.
b.
Use the equation to find the exact cost of the family meal when 5 beverages are purchased.
c.
ADVERTISEMENT
0 votes
Related Articles
Related forms


Related Categories
Parent category: Education