Maths Connect 2b - Diagrams And Tables - Probability Worksheet Page 10
ADVERTISEMENT
 1
1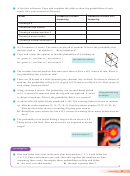 2
2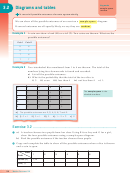 3
3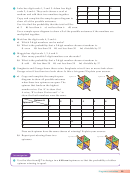 4
4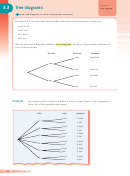 5
5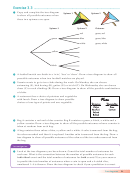 6
6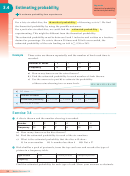 7
7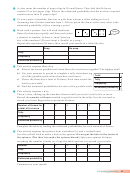 8
8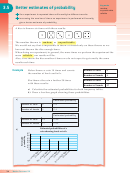 9
9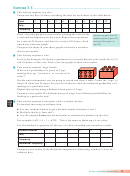 10
10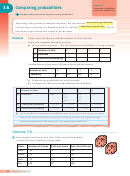 11
11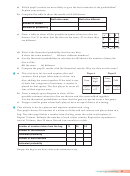 12
12Exercise 3.5 .............................................................................................
This activity requires two dice.
Throw the two dice 10 times, recording the total for each throw in the table below.
Total
2
3
4
5
6
7
8
9
10
11
12
Tally
Frequency
Draw a bar-line graph for your results, plotting the total on the
You can use your first 10
x-axis and the frequency on the y-axis. Repeat this experiment
throws as part of your 20,
for a total of 20 throws, and then for a total of 50 throws. Each
and your 20 as part of
time draw a bar-line graph.
your 50.
Compare the shape of your three graphs and write a sentence
about your results.
This activity requires a coin.
Look at the Example. Do Helen’s experiment for yourself. Record your results for 10, 30
and 50 throws of the coin. Draw a bar-line graph to show your results.
This activity requires ‘Lego’ bricks.
What is the probability of a piece of ‘Lego’
landing ‘face up’, ‘face down’ or ‘on one of its
sides’?
Decide what information you are going to record and draw a table. Throw the ‘Lego’ 10
times, 30 times and 50 times. For each set of throws, find the estimated probability of it
landing on a particular side.
Repeat this activity using a different sized piece of ‘Lego’.
Compare your results. Do different pieces of ‘Lego’ have different probabilities for
landing in a particular way?
This activity requires a calculator with a ‘random’ button.
To simulate throwing an ordinary dice:
● Use the ‘random’ button to get a decimal number between 0 and 1.
● Multiply this by 6, then add 1.
● Use the number before the decimal point to simulate the number on the dice.
For example: 0.632
6
1
4.792. This is the same as throwing a 4 on a dice.
Use this method to generate 60 ‘throws’ of a dice, recording your results in a table.
Random number
1
2
3
4
5
6
Tally
Frequency
1
1
1
1
1
1
Theoretical frequency
6
6
6
6
6
6
Compare your results to the theoretical frequencies of throwing numbers 1–6 on an
ordinary dice.
Better estimates of probability
35
ADVERTISEMENT
0 votes
Related Articles
Related forms


")


Related Categories
Parent category: Education