Math 112 Final Exam Study Aid Worksheet With Answer Key Page 7
ADVERTISEMENT
 1
1 2
2 3
3 4
4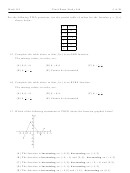 5
5 6
6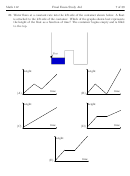 7
7 8
8 9
9 10
10 11
11 12
12 13
13 14
14 15
15 16
16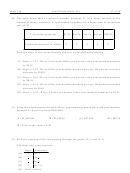 17
17 18
18 19
19 20
20 21
21 22
22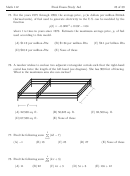 23
23 24
24 25
25 26
26 27
27 28
28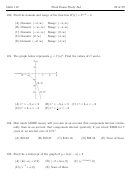 29
29 30
30 31
31 32
32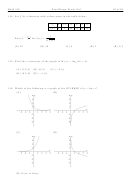 33
33 34
34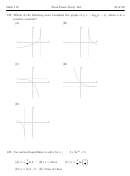 35
35 36
36 37
37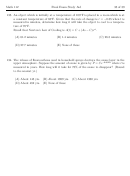 38
38 39
39Math 112
Final Exam Study Aid
7 of 39
20. Water flows at a constant rate into the left side of the container shown below. A float
is attached to the left side of the container. Which of the graphs shown best represents
the height of the float as a function of time? The container begins empty and is filled
to the top.
height
height
time
time
(A)
(B)
height
height
time
time
(C)
(D)
height
time
(E)
ADVERTISEMENT
0 votes
Related Articles
Related forms


Related Categories
Parent category: Education