Slope Intercept Form Worksheet Page 12
ADVERTISEMENT
 1
1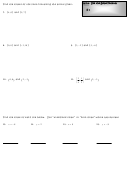 2
2 3
3 4
4 5
5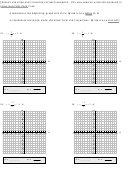 6
6 7
7 8
8 9
9 10
10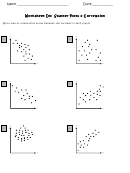 11
11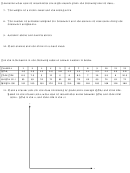 12
12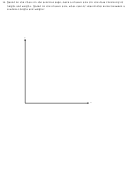 13
13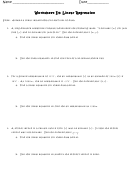 14
14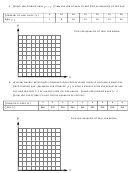 15
15 16
16 17
17 18
18 19
19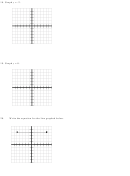 20
20 21
21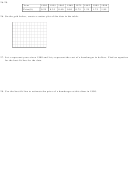 22
22Determine what type of relationship you might expect given the following sets of data…
7. The weight of a sirloin steak and the selling price
8. The number of problems assigned for homework and the amount of time spent doing the
homework assignment.
9. Athletic ability and musical ability
10. Math anxiety and the score on a math exam
Use the information in the following table to answer number 11 below.
Student
1
2
3
4
5
6
7
8
9
10
11
12
GPA
3.6
2.9
3.2
2.6
2.8
2.1
3.3
3.3
3.2
3.3
2.5
2.8
Shoe Size
8.5
7.5
9
11
6
8
8.5
7
10
9.5
8
10.5
Height (in.)
65
69
70
71
62
66
78
65
69
70
63
71
Weight (lb)
141
145
163
170
109
150
156
138
166
168
118
188
11. Make a scatter plot for the data consisting of grade point average (GPA) and shoe size.
Based on the scatter plot, what type of relationship exists between GPA and shoe size?
x
y
(Hint: GPA is the
, and shoe size is the
.)
y
x
ADVERTISEMENT
0 votes
Related Articles
Related forms


Related Categories
Parent category: Education