Slope Intercept Form Worksheet Page 22
ADVERTISEMENT
 1
1 2
2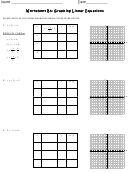 3
3 4
4 5
5 6
6 7
7 8
8 9
9 10
10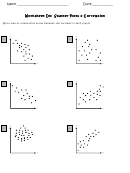 11
11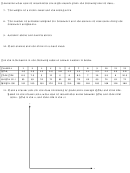 12
12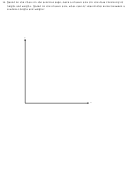 13
13 14
14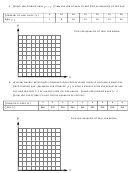 15
15 16
16 17
17 18
18 19
19 20
20 21
21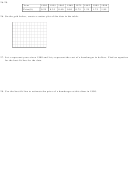 22
2226-28.
Year
1950 1955 1963 1969 1975 1982 1995 1998
Price($)
0.25
0.35
0.40
0.50
0.75
1.25
1.75
1.95
26. On the grid below, create a scatter plot of the data in the table.
27. Let x represent years since 1900 and let y represent the cost of a hamburger in dollars. Find an equation
for the best-fit line for the data.
28. Use the best-fit line to estimate the price of a hamburger at this diner in 1990.
ADVERTISEMENT
0 votes
Related Articles
Related forms


Related Categories
Parent category: Education