Formula For The Volume Of A Cylinder And Line Graphs Worksheets Page 6
ADVERTISEMENT
 1
1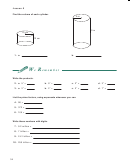 2
2 3
3 4
4 5
5 6
6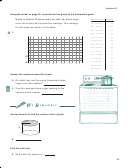 7
7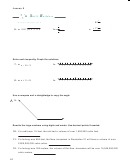 8
8 9
9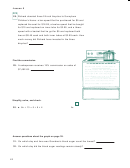 10
109
9
G
S
r a p h s
t a t i s t i c s
a n d
Building Line Graphs
Line graphs show change in a particular value. They use the same basic format as vertical bar graphs.
The number scale for a line graph must go up the left-hand side of the graph. The number scale for a line
graph, unlike a bar graph, doesn’t need to start at zero, since a line graph pictures the amount of change
over time, rather than comparing different totals.
Title
100
90
Label for
80
number
scale
70
60
50
E
F
C
D
A
B
Label for items being graphed
When plotting the points for the line, if a given value falls between two lines, estimate the correct
position of the point as closely as possible. In the graph above, item C is about 84.
Depending on the data being graphed, the line may be straight, curved, or broken. The graph shown
above is a broken-line graph. Two more line graphs are pictured below.
Straight Line Graph
Curved Line Graph
36
8
32
7
28
6
24
5
20
4
16
3
12
2
8
1
4
0
1
2
3
4
5
6
7
8
9
38
1
2
3
4
5
6
7
8
9
ADVERTISEMENT
0 votes
Related Articles
Related forms


 Parental Consent And Authorization For Release Of Information In The Possession Of The City Of Troy Police Department And For The Fingerprinting Of A Minor For Investigation Under Application Form For A Peddler's License
Business
Parental Consent And Authorization For Release Of Information In The Possession Of The City Of Troy Police Department And For The Fingerprinting Of A Minor For Investigation Under Application Form For A Peddler's License
Business
 Fms Form 236 - Specific Power Of Attorney By A Corporation For The Collection Of A Specified Check Drawn On The United States Treasury
Legal
Fms Form 236 - Specific Power Of Attorney By A Corporation For The Collection Of A Specified Check Drawn On The United States Treasury
Legal
 Application For The Benefit Of A Reduced Tuition Rate As A Member Of The Armed Services Or Dependent Relative Form
Business
Application For The Benefit Of A Reduced Tuition Rate As A Member Of The Armed Services Or Dependent Relative Form
Business
 Consent To The Use Of A Name - Minnesota Secretary Of State, Affidavit For The Registration Of A Name - Minnesota Secretary Of State
Legal
Consent To The Use Of A Name - Minnesota Secretary Of State, Affidavit For The Registration Of A Name - Minnesota Secretary Of State
Legal

 Form Rp-1573-acr-a - Application For Review For The Maintenance Of A System Of Improved Real Property Tax Administration Aid
Financial
Form Rp-1573-acr-a - Application For Review For The Maintenance Of A System Of Improved Real Property Tax Administration Aid
Financial


Related Categories
Parent category: Education