Graphs, Equations, And Inequalities Worksheets
ADVERTISEMENT
 1
1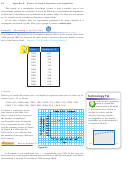 2
2 3
3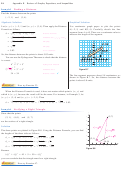 4
4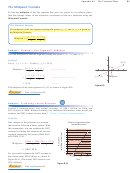 5
5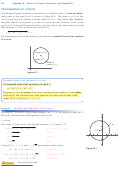 6
6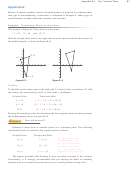 7
7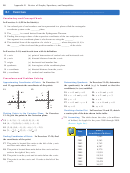 8
8 9
9 10
10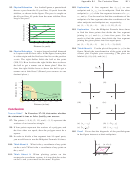 11
11Appendix B: Review of Graphs, Equations,
and Inequalities
B.1 The Cartesian Plane
What you should learn
The Cartesian Plane
Plot points in the Cartesian
●
Just as you can represent real numbers by points on a real number line, you can
plane and sketch scatter plots.
represent ordered pairs of real numbers by points in a plane called the rectangular
Use the Distance Formula to find
●
coordinate system, or the Cartesian plane, after the French mathematician René
the distance between two
Descartes (1596–1650).
points.
The Cartesian plane is formed by using two real number lines intersecting at right
Use the Midpoint Formula to
●
angles, as shown in Figure B.1. The horizontal real number line is usually called the
find the midpoint of a line
x
-axis, and the vertical real number line is usually called the -axis. The point of
y
segment.
intersection of these two axes is the origin, and the two axes divide the plane into four
Find the equation of a circle.
●
parts called quadrants.
Translate points in the plane.
●
y-axis
y-axis
Why you should learn it
The Cartesian plane can be used to
3
Quadrant II
Quadrant I
Directed distance
represent relationships between two
2
x
(Vertical
variables. For instance, Exercise 93
1
number line)
on page B10 shows how to represent
Origi n
(x, y)
graphically the numbers of performers
x-axis
− 3 −2 − 1
1
2
3
elected to the Rock and Roll Hall of
y Directed distance
− 1
(Horizontal
Fame from 1991 through 2010.
x-axis
number line)
− 2
Quadrant III
Quadrant IV
− 3
Figure B.1
The Cartesian Plane
Figure B.2
Ordered Pair
(x, y)
Each point in the plane corresponds to an ordered pair
x, y
of real numbers and
x
y,
called coordinates of the point. The -coordinate represents the directed distance
x
from the -axis to the point, and the -coordinate represents the directed distance from
y
y
the -axis to the point, as shown in Figure B.2.
x
x, y
Directed distance
Directed distance
from y-axis
from x-axis
The notation
(x, y)
denotes both a point in the plane and an open interval on the real
number line. The context will tell you which meaning is intended.
Plotting Points in the Cartesian Plane
Example 1
y
Plot the points
1, 2 ,
3, 4 ,
0, 0 ,
3, 0 ,
and
2,
3
in the Cartesian plane.
4
(3, 4)
3
Solution
(−1, 2)
To plot the point
1, 2 ,
imagine a vertical line
1
through
1
on the -axis and a horizontal line
x
(0, 0)
(3, 0)
x
through 2 on the -axis. The intersection of
y
− 4
− 3
− 1
1
2
3
4
− 1
these two lines is the point
1, 2 .
This point
is one unit to the left of the -axis and two units
y
− 2
up from the -axis. The other four points can be
x
(−2, − 3)
plotted in a similar way, as shown in Figure B.3.
− 4
.
Now try Exercise 13
Figure B.3
B1
ADVERTISEMENT
0 votes
Related Articles
Related forms


Related Categories
Parent category: Education