Graphs, Equations, And Inequalities Worksheets Page 2
ADVERTISEMENT
 1
1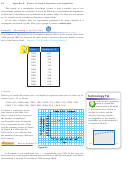 2
2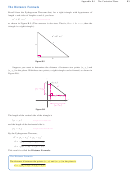 3
3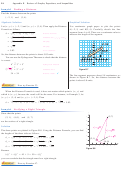 4
4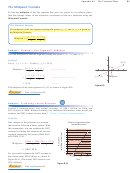 5
5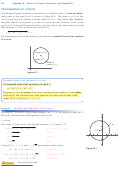 6
6 7
7 8
8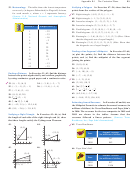 9
9 10
10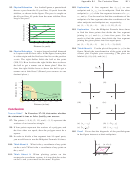 11
11B2
Appendix B
Review of Graphs, Equations, and Inequalities
The beauty of a rectangular coordinate system is that it enables you to see
relationships between two variables. It would be difficult to overestimate the importance
of Descartes’s introduction of coordinates in the plane. Today, his ideas are in common
use in virtually every scientific and business-related field.
In the next example, data are represented graphically by points plotted in a
rectangular coordinate system. This type of graph is called a scatter plot.
Example 2
Sketching a Scatter Plot
The numbers of employees
E
(in thousands) in dentist offices in the United States from
1999 through 2009 are shown in the table, where represents the year. Sketch a scatter
t
plot of the data by hand.
(Source: U.S. Bureau of Labor Statistics)
Year, t
Employees, E
1999
667
2000
688
2001
705
2002
725
2003
744
2004
760
2005
774
2006
786
2007
808
2008
818
2009
818
Solution
Before you sketch the scatter plot, it is helpful to represent each pair of values by an
Technology Tip
ordered pair
t, E
as follows.
You can use a graphing
1999, 667 ,
2000, 688 ,
2001, 705 ,
2002, 725 ,
2003, 744 ,
2004, 760 ,
utility to graph the
2005, 774 ,
2006, 786 ,
2007, 808 ,
2008, 818 ,
2009, 818
scatter plot in Example
2. For instructions on how to
To sketch a scatter plot of the
use the list editor and the
data shown in the table, first
statistical plotting feature,
draw a vertical axis to represent
see Appendix A; for specific
the number of employees
keystrokes, go to this textbook’s
(in thousands) and a horizontal
Companion Website.
axis to represent the year. Then
plot the resulting points, as shown
900
in Figure B.4. Note that the
break in the -axis indicates that
t
the numbers 0 through 1998 have
been omitted.
.
Now try Exercise 31
1998
2010
0
Figure B.4
In Example 2, you could have let
t
1
represent the year 1999. In that case, the
horizontal axis of the graph would not have been broken, and the tick marks would have
been labeled 1 through 11 (instead of 1999 through 2009).
ADVERTISEMENT
0 votes
Related Articles
Related forms


Related Categories
Parent category: Education