Statistical Graphs, Charts, Tables, Percentages, Percentile Worksheet With Answers - Unit 2, Module 8
ADVERTISEMENT
 1
1 2
2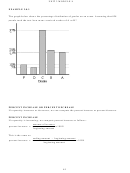 3
3 4
4 5
5 6
6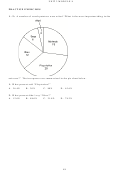 7
7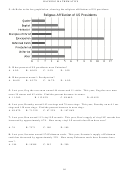 8
8 9
9 10
10UNIT 2 MODULE 8
UNIT 2 MODULE 8
STATISTICAL GRAPHS, CHARTS, TABLES, PERCENTAGES, PERCENTILE
EXAMPLE 2.8.1
The bar graph below shows the results of a survey in which a number of dogs were asked "What
is your favorite food?" No dog gave multiple answers.
What percent of dogs said that their favorite food was cats?
A. 6%
B. 17%
C. 11%
D. 30%
EXAMPLE 2.8.1 SOLUTION
First, we find the number of dogs who responded to the survey. We do this by recognizing that
the numbers on the horizontal axis tell how many dogs gave each of the four responses. If we
add those four numbers, we have the total number of dogs who responded:
6 + 11 + 17 + 22 = 56
There were 56 dogs who responded to the survey (we say that in this survey the sample size or
sample population is 56, or simply that n = 56).
Now we read the graph and see that 6 of the 56 dogs gave the response "cats." Thus, we need to
find the percentage that corresponds to "6 out of 56." To do this, we divide 6 by 56, and then
multiply by 100%.
6
"100% # .107 "100%
56
= 10.7%
!
83
ADVERTISEMENT
0 votes
Related Articles
Related forms


Related Categories
Parent category: Education