Writing Linear Equations And Inequalities Worksheet Page 13
ADVERTISEMENT
 1
1 2
2 3
3 4
4 5
5 6
6 7
7 8
8 9
9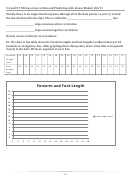 10
10 11
11 12
12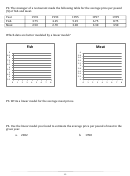 13
13P2. The manager of a restaurant made the following table for the average price per pound
($) of fish and meat.
Year
1991
1993
1995
1997
1999
Fish
3.75
4.25
5.25
6.75
8.75
Meat
2.50
2.70
3.00
3.30
3.50
Which data are better modeled by a linear model?
Meat
Fish
4
9
8.5
3.8
8
3.6
7.5
3.4
7
3.2
6.5
3
6
2.8
5.5
2.6
5
2.4
4.5
2.2
4
2
3.5
0
1
2
3
4
5
6
7
8
0
1
2
3
4
5
6
7
8
P3. Write a linear model for the average meat prices.
P4. Use the linear model you found to estimate the average price per pound of meat in the
given year.
a.
2002
b.
1998
13
ADVERTISEMENT
0 votes
Related Articles
Related forms


Related Categories
Parent category: Education